

· Bank of America Corporation, Inc.’s stock is moving downward.
· Bank of America Corporation, Inc.’s ROIC has declined by 68.4% YoY.


Bank of America Corporation (NYSE: BAC) is a bank holding company and financial services firm. Its main divisions encompass Consumer Banking, Global Wealth and Investment Management (GWIM), Global Banking, and Global Markets.
Bank of America Corporation, Inc.’s stock price is moving with a downtrend momentum. The price is forming a pattern of lower lows.
Bank of America Corporation, Inc.’s stock is currently trading at $27.64, with a decline of 1.46% in today’s market session. The return on invested capital (ROIC) of BAC stock for Q2 2023 is 8.1%, with a decline of 68.4% YoY. This indicates that the stock is performing poorly.
BAC stock has experienced a decline of approximately 17.02% over the past year. It currently exhibits an uncertain trading pattern in the present market conditions.
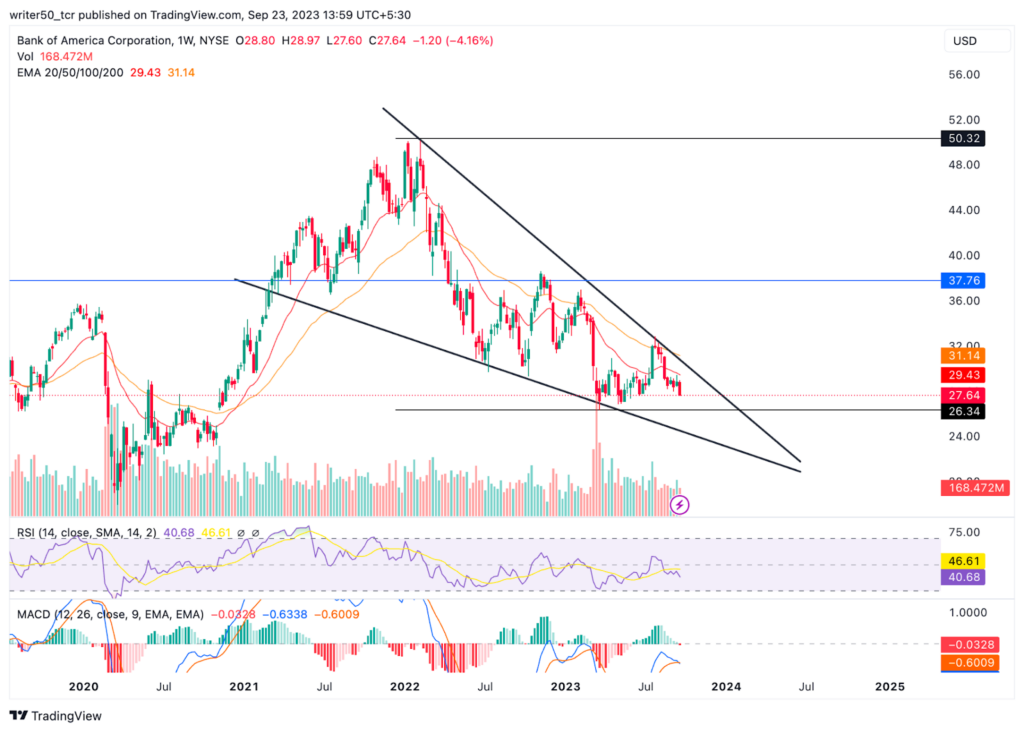
In February 2022, BAC stock reached its all-time high at $50.11, after which it initiated a downward trajectory. That resulted in a significant decrease of more than 45% since that peak. Nevertheless, the stock found support at around $26. The price movement of BAC stock has formed what technical analysts call a descending triangle pattern. This typically indicates a bearish trend.
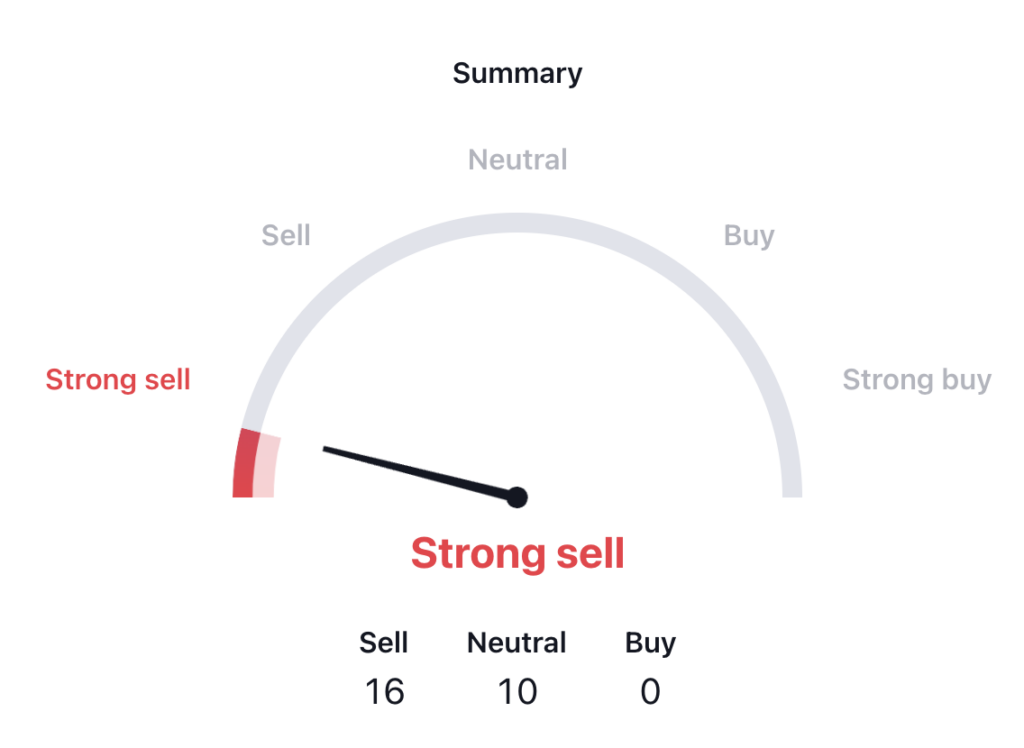
Currently, the stock is trading close to a critical support level. A breach of this support level could lead to a substantial decline in the coming days. According to the technical indicators widget, there is a prevailing strong sell signal for the stock. 16 out of a total of 26 indicators are giving a ‘sell’ signal, while the remaining 10 are neutral, and none point to a ‘buy’ signal. This collective data suggests that the stock’s current condition is considerably weak.
Bank of America Corporation (BAC) Stock Price Analysis
Technical Indicators’ Overview
The current status of the BAC stock price reveals that it is trading below both the 50-day and 100-day exponential moving averages (EMAs). Additionally, there is an ongoing bearish crossover between these EMAs, suggesting a potential future decline in the stock price.
Furthermore, the relative strength index (RSI) line has dipped below the neutral zone. It is positioned below the simple moving average (SMA) line. This configuration signifies a negative momentum in the stock.
The moving average convergence divergence (MACD) line is currently residing below the zero line, indicating a negative zone. Moreover, the signal line is situated above the MACD line, further reinforcing a negative signal.
Conclusion
In conclusion, BAC stock has shown a negative momentum in the previous year. Additionally, the overall chart pattern of the stock is negative and the indicators are also giving a weak signal. Hence, the price is moving in a downtrend and it is likely to decline in the upcoming days.
Technical Levels
Support Level: $26.34
Resistance Level: $32.6
Disclaimer
The views and opinions of the author or anyone in this article are for informational purposes only. They do not offer financial, investment, or other advice. Investing in or trading crypto assets involves the risk of financial loss.


