

- On 22 September 2023, AZN reported positive results in the Phase 3 trial of breast cancer treatment, resulting in the share price rising by 1.7%.
- The company’s price has risen by 1.47% since the last trading session.
AstraZeneca Plc is a pharmaceutical company that works in the field of research, development, and commercialization of medicine prescription. It was established on 17 July 1992.
AstraZeneca (AZN) Stock: Technical Analysis
The company stock price is trading at 11046 GBX at the time of writing with a market capitalization of $168.722 Billion. The 10-day average trading volume is around $2.1 Million. In the last trading session, the stock traded with a volume of $2.655 Million gained 1.47% since then.


Technical Analysis on 1-Day Timeframe
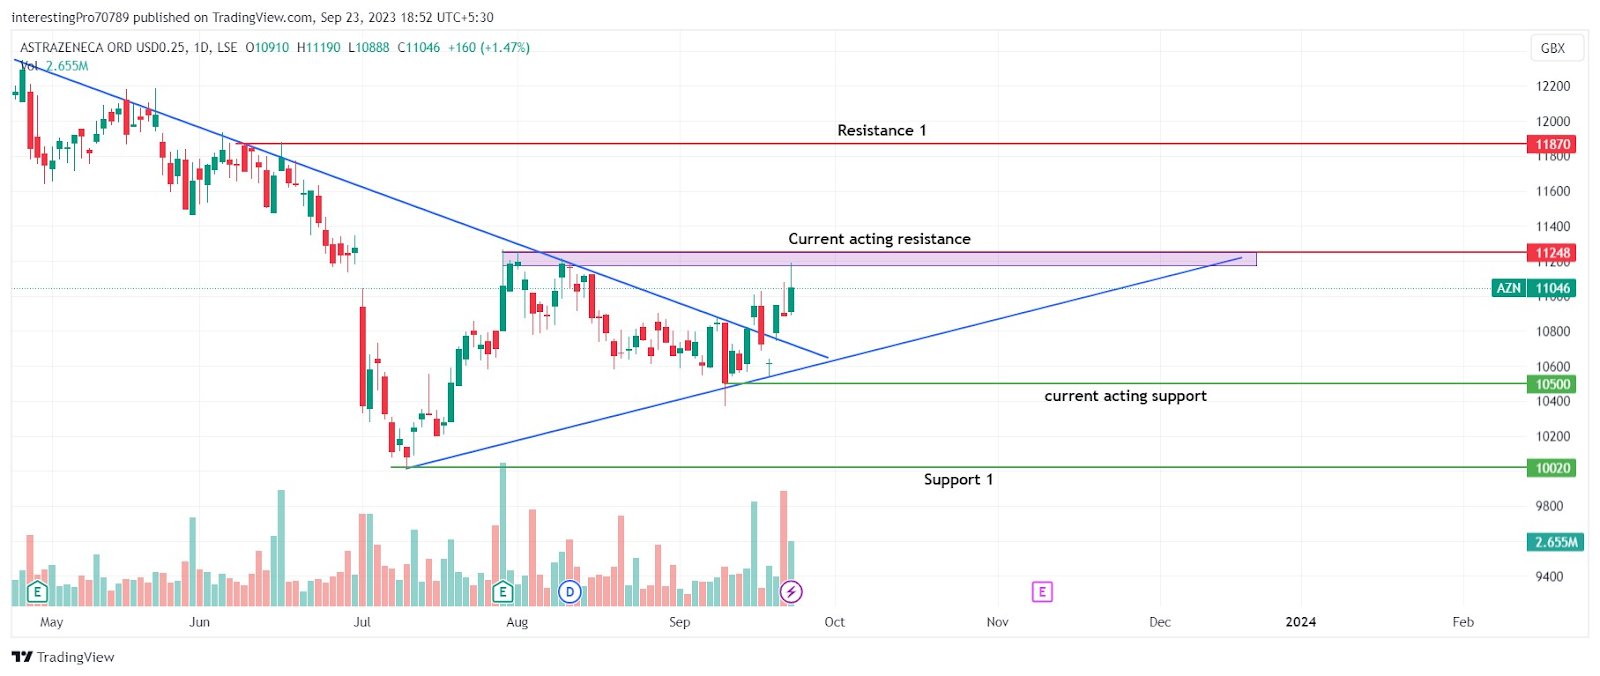
In the last 10 days, the price has gained around 5.30%. Recently, the price has given the breakout of the symmetrical triangle pattern and has reached its 11248 GBX resistance. The price has faced rejection from there where the sellers are showing their presence.
If the price fell from here and took support from the trendline forming below. It could be seen forming an ascending triangle pattern which is a bullish pattern. After that the price gave the breakout of 11248 GBX then it may rise to its next resistance at 11870 GBX.
As long as the price is sustaining above 10500 GBX the price could be seen under the control of the buyer. The moment the price closes below the 10500 GBX level the sellers can be seen taking in charge of the price and making it fall to its support at 10020 GBX.
Technical Indicators On The Current Trend
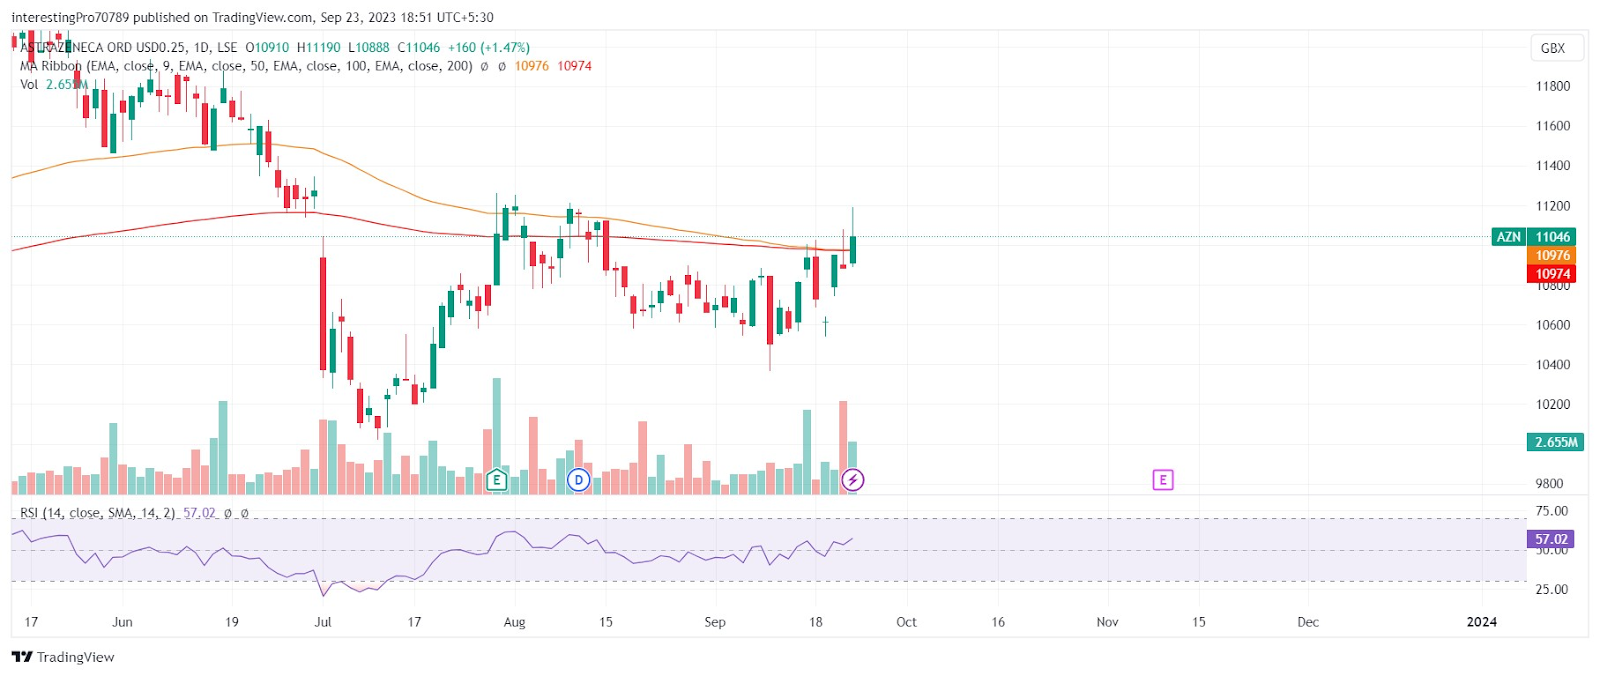
The AZN price has breached above the 50 and 200 ema lines indicating the buyers hold over the price. However, the ema lines are completely sideways because of the 11248 GBX resistance above it.
The relative strength index is at 57.02 and the RSI line is trending in the upward direction. This shows that the RSI line is in bullish territory and the trending RSI line indicates more room for buyers on the upside to raise the price.
Conclusion
The AstraZeneca stock price is in bullish sentiment at the time of writing. The price is trading in a narrow range of 11248 GBX (current acting resistance) to 10500 GBX (current acting support). If the price breaks above 11248 GBX then it may rise to its next resistance at 11870 GBX. However, for the price to be in bearish sentiment and close below 10500 GBX then it may fall to its support at 10020 GBX.
Technical levels
Resistance levels: 11248 GBX and 11870.
Support levels: 10500 GBX and 10020 GBX.
Disclaimer
The views and opinions stated by the author or any other person named in this article are for informational purposes only. They do not provide financial, investment, or other advice. Investing in or trading in the stock market comes with a risk of financial loss.


