

- The T-coin price has surged by over 4% in a week.
- The MACD is about to close above the zero line.
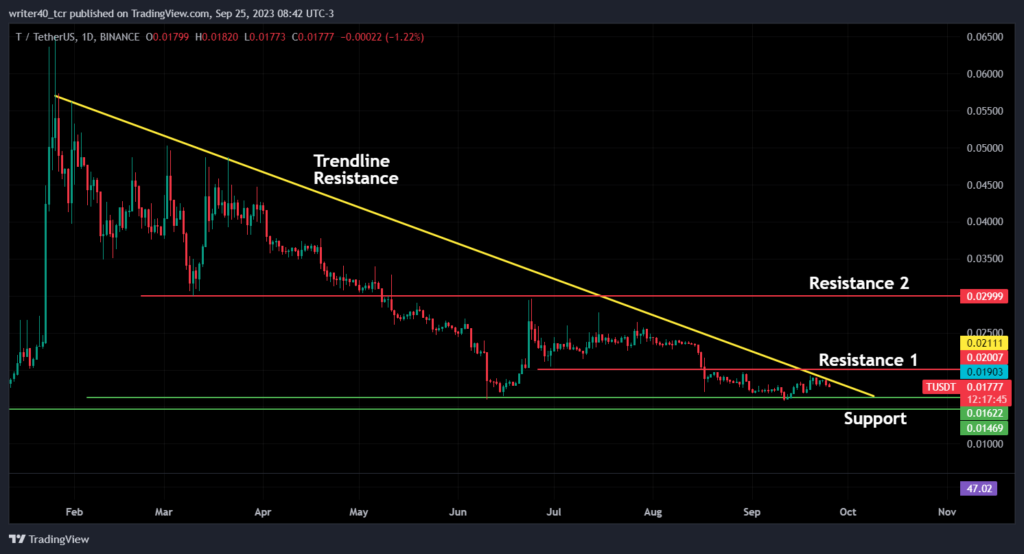
- This crypto asset’s price has formed a descending triangle pattern on a daily time frame.
Market capital of the T-coin – $160.272 Million
Current Market The T-coin’s Price – $0.01777


Threshold Coin Overview:
In the current trading session, the “T” coin Price is trading with some selling pressure. The price is trading with a decline of $0.00022 or 1.22%. The price has surged by over 4% in a week but declined by 4.21% in a month. It indicates that the price is trading flat and both buyers and sellers are trying to dominate each other.
The token price has slumped by over 42% in a year, which signifies that the price is in a strong downtrend. The T-coin Price has been rising slightly from the lower levels. It has respected the previous support level of $0.01622, which states that the buyers are still present at that level.
Technical Analysis of T-coin
The T-Coin has formed a descending triangle kind of pattern and the price is currently trading very close to the resistance level. The resistance level of the Descending Triangle Pattern is present near the level of $0.01853. Its horizontal resistance level is present at the level of $0.02007.
The other resistance level for the price is present at the level of $0.02999. This is a swing high of the previous upside the coin has shown in the month of June. If we talk about the support level, then the has taken support from the level $0.01622-$0.01469. Price has taken support near this level thrice which states that the buyers are aggressive at this level.
What Bollinger Band Is saying about the price?
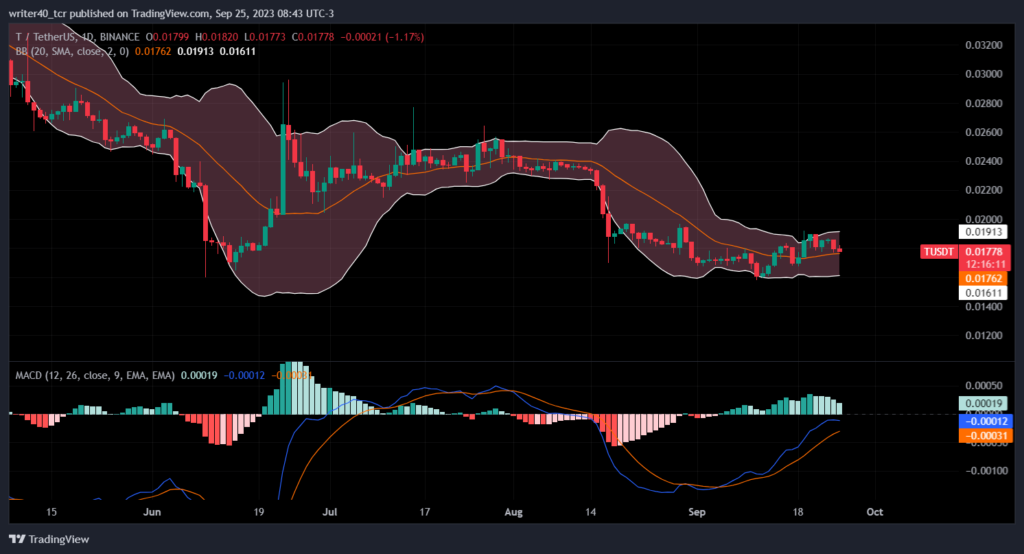
The Bollinger band on the chart has squeezed which indicates that the price is less volatile and trading in a tight range. The upper band of the Bollinger band is present at $0.01913 and the lower band is present at $0.01611 level. This will act as resistance and support for the price. The MACD has shown a crossover and is now trying to close above the zero line which is a bullish sign.
Conclusion
The T-coin’s Price is forming a base near the support level of $0.0162. The Bollinger Band has been squeezed, which indicates that the price can show massive volatility ahead on either side. If the price breaks the descending triangle pattern on the upside, it price can try to achieve the level of $0.02999. If it breaks the level of $0.01469 on the downside, it can try to go towards the level of $0.01000.
Technical Levels
Resistance – $0.02007 and $0.02999
Support – $0.01622 and $0.01469
Disclaimer
The views and opinions stated by the author, or any people named in this article, are for informational purposes only. They do not establish financial, investment, or other advice. Investing in or trading crypto assets comes with a risk of financial loss.


