

- The COST stock price has gained more than 5% in the last 30 trading days.
- The company stock chart reflects the bull’s control over the price.
Costco Wholesale Corp. (NASDAQ: COST) is an international chain of warehouses that runs under the name of “Costco Wholesale”. It offers quality brand-name merchandise substantially at lower prices compared to conventional wholesale or retail sources.
Costco Wholesale Corp. (COST) Stock: Technical Analysis
The Costco Wholesale corporation is currently trading at $558.59 and is up by 0.63% from the previous day. The company’s market capitalization is valued at 247.538 Billion dollars. Its price has been trading with an average 10-day trading volume of 1.449 Billion dollars.


Technical Analysis on 1-Day Timeframe
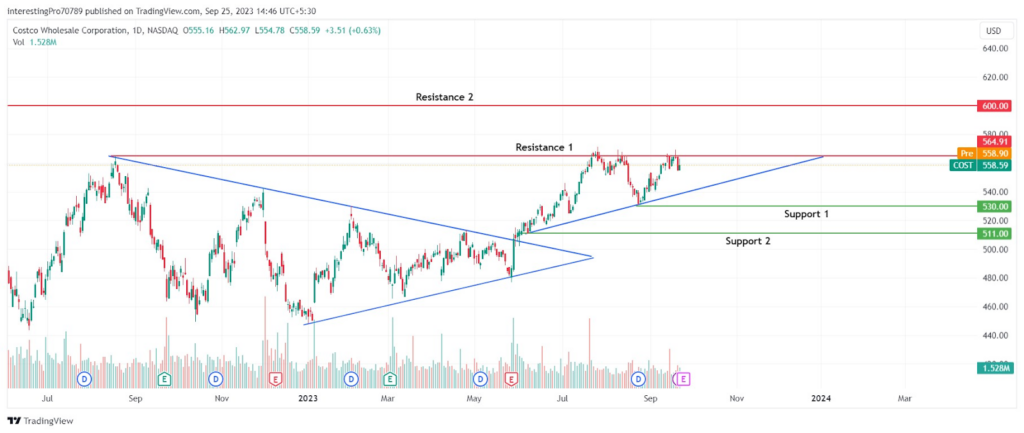
The Cost Wholesale stock price is in a steady uptrend after giving the breakout of the symmetrical triangle pattern. The price has gained a 5.30% up move in the last 30 trading session days.
The price has been continuously facing rejection from the 564.90 resistance and has the support of a trendline which is forming below.
In the second last trading session day, the price formed a strong bearish candle from the $564.90 resistance. It could lead the price fall to the trendline at the downside. If the price took support from the trendline and again moved to $564.90 resistance, it may seen forming an ascending triangle pattern.
However, for the continuation of the bullish rally, the buyers should close the price above the $564.90 resistance. Thus, the price could be seen continuing the bullish rally till the $600 level, which will act as its next resistance. As long as the price is sustained above the $530 level, the buyers can be seen in the charge of the price. If the price breaks below the $530 level then it may fall to its next support at $511.
Technical Indicators On The Current Trend
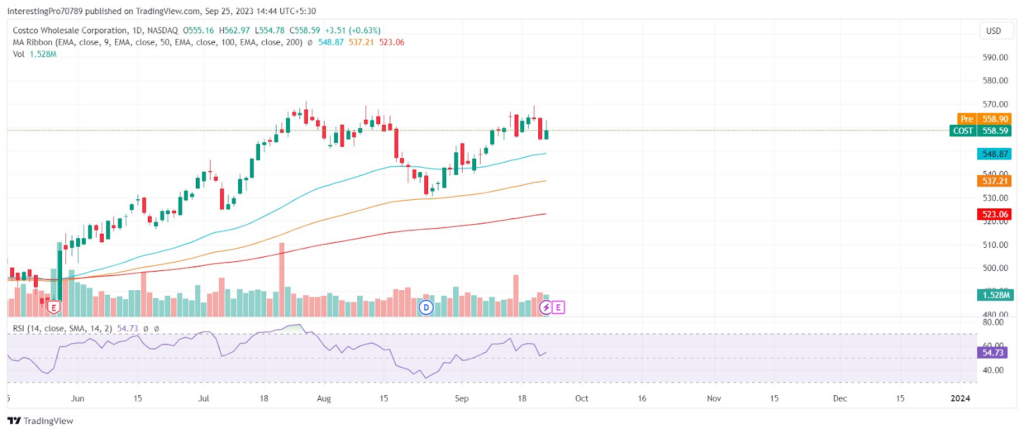
The COST price is trading above 50, 100, and 200 exponential moving average lines. All the EMA lines are trending in the upward direction. It indicates that the bulls are in control of the buyers.
The relative strength index is at 54.73 and sloping in the upward direction. This indicates the price is currently in the neutral territory but the sloping RSI shows more room for buyers in the upward direction.
Conclusion
Overall, Costco Wholesale Corporation stock technical analysis shows that the price is in a steady uptrend. The indicators mentioned above for the analysis of the stock price trend analysis are pointing towards the bulls’ control over the price. The Analyst ratings are also for a strong buy of this stock.
Technical levels
Resistance Levels: $564.90 and $600.00.
Support Levels: $530.00 and $511.00.
Disclaimer
The views and opinions stated by the author or any other person named in this article are for informational purposes only. They do not provide financial, investment, or other advice. Investing in or trading comes with a risk of financial loss.


