

- The ZRX coin has experienced a decline of 1.25% and is currently trading at $0.1807.
- The coin price is currently trading inside a falling wedge pattern.
The Ox (ZRX) coin was launched in 2017 as an ERC20 token. Similar to other crypto assets, it belongs to a decentralized platform governed by its users.
Ox (ZRX) Technical Analysis
The ZRX coin has decreased by 1.25% over the past 24 hours and the current price of the


The coin is at the $0.1807 level as of this writing. The market capitalization of the token is $154,106,813, down 3.15 percent over the previous day. Additionally, the token has a maximum limit of 1,000,000,000 ZRX coins and a circulating supply of 847,496,055 ZRX coins.
Technical Analysis on 1-Day Chart
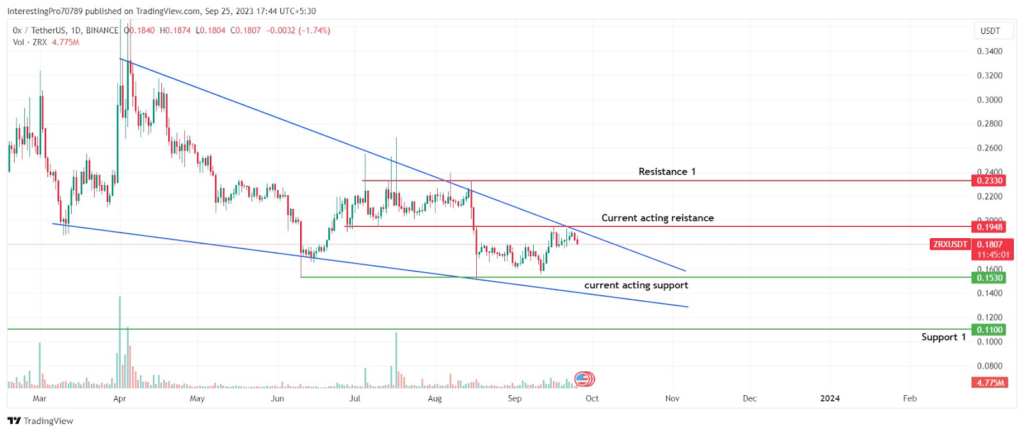
While monitoring the 1-day chart of ZRX coin, the price seems to be trading inside a falling wedge. The price has gained more than 14% move after commencing a bullish rally from $0.1530 support. Its $0.1530 support seems a quite strong level as the buyers have pushed the price in the upward direction many times.
The coin price was falling in higher low and lower low formation. Each recent high reflects the seller’s dominance. But recently, the price has been denied to close below the recent low made by the price.
If we look at the chart we can also see that it is trading in a range of $0.1948 (resistance) to $0.1530 (support). The price is currently facing rejection from the $0.1948 resistance and the trendline coming from above.
The price may give the breakout of the falling wedge pattern and close above the $0.1948 resistance. Ite can then commence a bullish move to its next resistance at $0.2330. However, for the price to be in bearish sentiment it should give the breakout of $0.1530 then it may fall to $0.1100.
Technical Indicators On The Current Trend
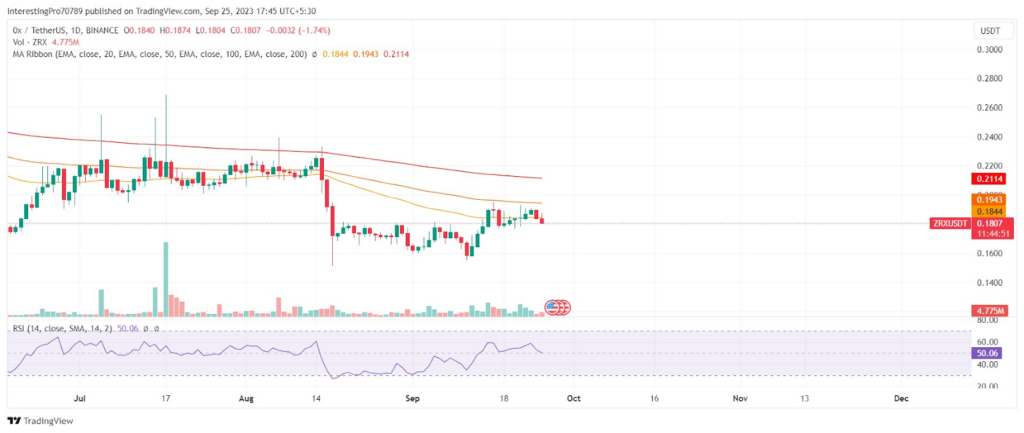
ZRX coin price is trading below 50, 100, and 200 EMA lines indicating the price could fall as the bears have control of the price as of right now.
The relative strength index is at 50.06 and is sloping downwards. This indicates the RSI line is in neutral territory but the downward sloping of the RSI lines can invite more sellers as there is room in the downside.
The long/short ratio of ZRX shows that the short positions have been placed more than the long positions in the last 24 hours. The short positions that are placed are 56.81% and the long positions that have been placed are 43.19%.
Conclusion
The technical analysis and the technical indicators indicate the price is in a bearish sentiment. It is trading in the range of $0.1948 (making it as a resistance) to $0.1530 (making it as a support). The breakout or breakdown of this range will decide the future trend of the price. If the price gives the breakout $0.1948 resistance, it can rise to its next resistance at $0.2330. However, for the price to be in bearish sentiment it should give the breakout of $0.1530 then it may fall to $0.1100.
Technical levels
Resistance Levels: $0.1984 and $0.2330.
Support Levels: $0.1530 and $0.1100.
Disclaimer
The views and opinions stated by the author or any other person named in this article are for informational purposes only. They do not provide financial, investment, or other advice. Investing in or trading crypto assets comes with a risk of financial loss.


