

· The ZEC coin has given a return of 5.05% in the previous month and -14% in the last three months.
· As per the technical indicators widget, the Zcash coin is showing a movement in a neutral direction.


· ZEC coin is trading at $26.02, with an increase of .05% in the last 24 hours.
Zcash stands as a decentralized digital currency with a strong emphasis on safeguarding privacy and ensuring anonymity for its users. Its underlying technology, zk-SNARK zero-knowledge proof, empowers network nodes to authenticate transactions without disclosing any confidential details regarding specific transactions.
The ZEC coin is currently indicating a neutral direction. The price respects the crucial support level.
Financial Data of ZCash (ZEC)
The ZEC coin is currently trading at $26.02, which has increased by 1.05% in today’s market session. As per CoinGlass, the volume of Zcash is $10.82 Million, which has shown a rise of 28.56%, reflecting an increase in market activity. On the other hand, the OI of the coin is $12.02 Million, which has decreased by 6.01%.
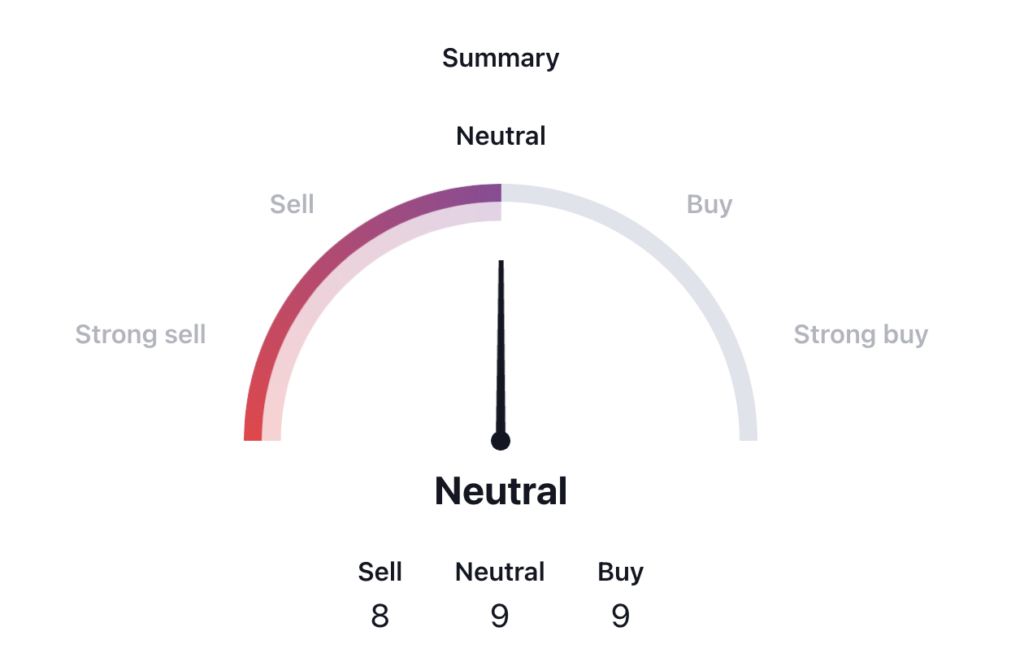
According to the technical indicator widget on TradingView, among the 26 top indicators, 8 are giving a buy signal, while 9 remain neutral regarding the coin. Consequently, the price is expected to exhibit flexibility and could move in either direction based on market conditions.
The ZEC coin experienced its swing high at $370.99 back in May 2021, almost two years ago. Since then, its value has undergone a substantial decline, marking a decrease of approximately 94%.
However, it is noteworthy that the coin has identified support at the $23 level and is currently trading in close proximity to this support level. The price movement has formed a falling wedge pattern. Should the price break below the $23 support level, it could experience further depreciation, but if it reverses course from this support level, there might be potential for an upward movement in the future.
ZCash (ZEC) Technical Analysis
ZEC by writer50_tcr on TradingView.com
Technical Indicators Summary
The current state of the ZEC coin’s price indicates a certain level of vulnerability, as it is trading below both the 50-day and 100-day exponential moving averages (EMA). This situation implies a bearish trend that could persist in the future.
Looking at the MACD indicator, ZEC is positioned above the signal line, and there’s a green bar visible on the MACD histogram. These factors collectively suggest the potential for price decreases in the upcoming days.
When observing the RSI line and SMA line for ZEC, they both hover around the 35 level. Notably, the RSI line seems to be attempting to cross over the SMA line, which could signal a potential price reversal. This further indicates the possibility of a price turnaround in the near future.
Conclusion
Based on the assessment, the ZEC coin is trading at a price close to its historical low. The current situation sees the coin trading below both the 50-day and 100-day EMA levels, indicating a prevailing negative momentum. However, the RSI and MACD indicators are displaying positive signals.
Considering the current state of the market, ZEC’s momentum appears uncertain. A decisive move in either direction will likely provide greater clarity regarding its trend.
Technical Levels
· Support Level: $23
· Resistance Level: $26
Disclaimer
The views and opinions of the author or anyone named in this article, are for informational purposes only. They do not offer financial, investment, or other advice. Investing or trading crypto assets involves the risk of financial loss.


