

- The FuboTv has generated a net loss for the 5 consecutive years.
- This stock has declined by over 42% in a year.
- The revenue has surged by over 23500% in 3 years.
Market capital of FuboTV stock – $693.425 Million
The current market price of the FuboTV – $2.3


FuboTV Stock’s Overview
The FuboTV stock has surged by $0.06 with a rise of 2.6% intraday. The stock has declined by over 10% in a week, which indicates that the sellers are currently dominating the price in the short term. Although the price has escalated by over 14.49% in a month which signifies that the bulls took control over the price throughout the month. Price has declined by over 42% in the years showing that the price is in an overall downtrend.
The revenue of the company has jumped massively by more than 23500% in the last 3 years. In 2016 the revenue of the company was just $23k, which increased to $4.27 Million in 2019. The revenue then showed a massive jump from $4.27 million in 2019 to $1.01 Billion in 2022.
If we talk about the company’s net income, it has generated net profit only once in the last six years’ span. Apart from the year 2017, the company has posted a net loss every year and it has been increasing over the years. The net debt of the company has also risen significantly, which is not at all a good sign for the company.
Technical Analysis of the FuboTV Stock
The stock has formed a rising trendline support for the price and is currently trading very close to that. It is facing a strong rejection near the level of $3.27, which is marked as Resistance 1 on the chart. The nearest support for the price apart from the trendline is present near the $2.37 level, which is marked as Support 1 on the chart.
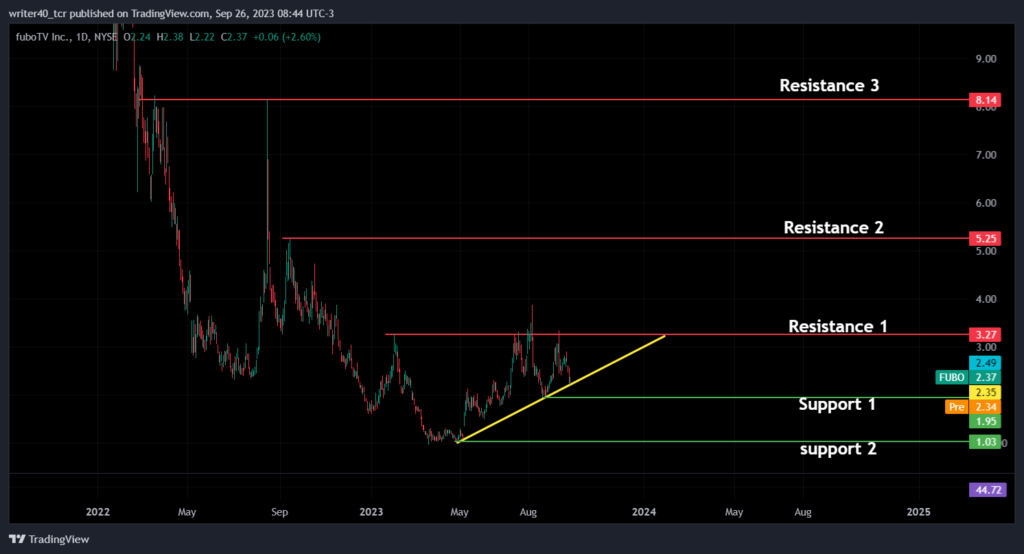
If we talk about another resistance level, the major resistance is present near the level of $5.25 and it is marked as Resistance 2. The next possible resistance level is present near the level of $8.14. The support level for the price is present near the level of $1.03 which is marked as Support 2 on the chart.
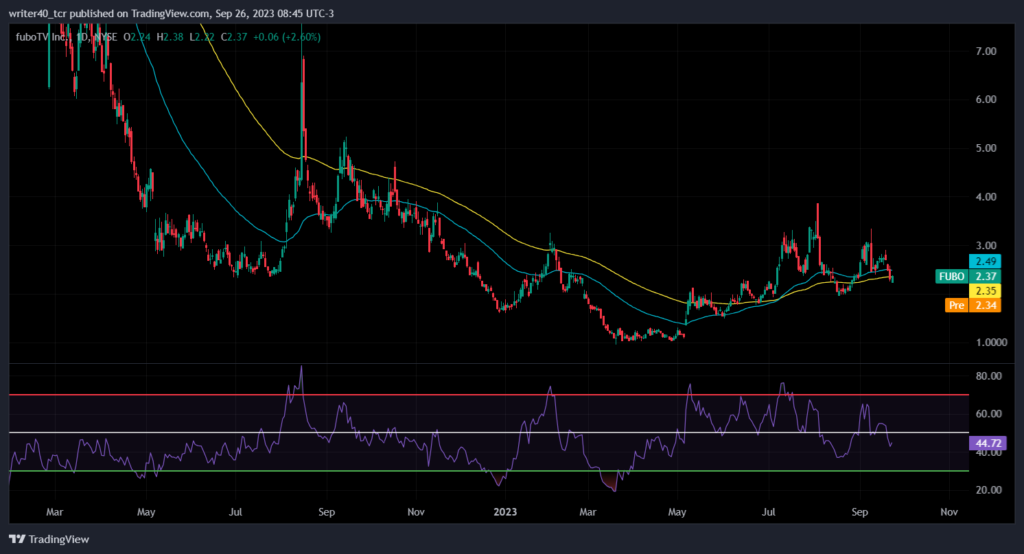
The stock price is currently trading above the 50-day and 100-day exponential moving averages, which is a bullish sign for the stock. The slope of the EMA is uniform which signifies that the price is consolidating in a range. If we observe, the Relative Strength Index (RSI) is currently placed below 50. It is sloping down and it states that the bulls have lost momentum.
Conclusion
The short-term trend of the stock is upward, but the price is currently consolidating in a range. The financial aspect of the stock is performing poorly, which is affecting the stock price. If the company posts a surprise in its financial report, then only we can expect a sustainable uptrend otherwise the stock can continue its consolidation phase ahead.
Technical Level
Resistance – $3.27 and $5.25
Support – $2.37 and $1.03
Disclaimer
The views and opinions stated by the author, or any people named in this article, are for informational purposes only. They do not establish financial, investment, or other advice. Investing in or trading crypto assets comes with a risk of financial loss.


