

- The IOTA coin is trading at $0.148563 and has declined by 0.23% in the last 24 hours.
- The coin is currently trading in a falling wedge pattern.
MIOTA (IOTA) is a distributed ledger designed for the Internet of Things (IoT). It stores transactions on its ledger by using a directed acyclic graph.
MIOTA (IOTA) Coin: Technical Analysis
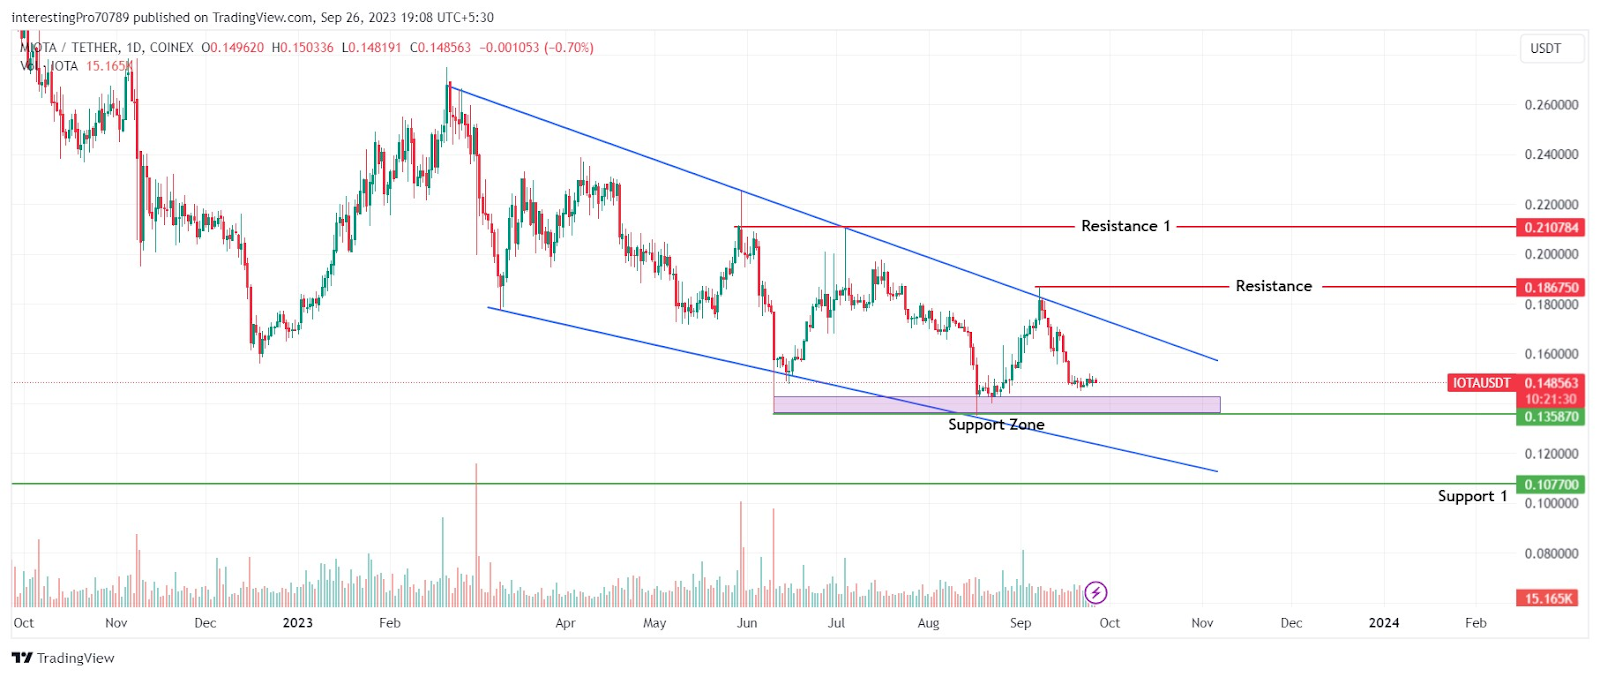
Looking at the 1-day chart, the IOTA coin has been in a continuous downtrend after creating its year-high of $0.274987. The price is trading inside a falling wedge pattern which is also known as a bullish pattern.


The price is trading with a support level of $0.148481 and a resistance level of $0.186750. In the last 18 trading sessions, the price has fallen by 17.76% after facing rejection from the upper trendline of the falling wedge pattern. The price is slowly approaching its support level of $0.13580.
If the price manages to give the breakdown of the $0.135870 support level, then it will continue its downtrend to its next support level at $0.107700. However, for the price to gain bullish momentum, it must give the breakout of $0.186750 after which it may rise to its next resistance at $0.210784. Otherwise, the price could consolidate between $0.135870 and $0.186750.
Technical Indicators On the Current Trend

The IOTA price has recently faced resistance from the 50 EMA and is trading below the 50, 100, and 200 EMAs. This indicates that the price is currently being pressurized by the sellers and is under their control.
The relative strength index is at 38.87. The RSI line is in bearish territory and this indicates the bears’ control over the price.
The volume bar of the coin has not shown any changes in the past trading days, pointing to the weak price movement in the IOTA chart.
The long/short ratio of the IOTA coin shows the large number of short orders being placed compared to long orders in the last 24 hours. In the last 24 hours, 58.09% of short orders have been placed whereas only 41.91% are of long orders.
Conclusion
The IOTA chart is currently showing the bearish sentiment over the price. The indicators mentioned above for the IOTA trend analysis are also bearish at the time of writing. The price is approaching the $0.13580 support zone. If the price breaks below the $0.13580 support zone, it will continue its fall to its next support at $$0.107700.
Technical levels
Resistance Levels: $0.186750 and $0.210784.
Support Levels: $0.135870 and $0.107700.
Disclaimer
The views and opinions stated by the author or any other person named in this article are for informational purposes only. They do not provide financial, investment, or other advice. Investing in or trading crypto assets comes with a risk of financial loss.


