
- The Chevron Corporation stock price is in an uptrend while moving toward $172.43.
- The CVX stock price gained almost 8.76% since the breakout from the downtrend.
- The stock price retraces toward the range between $162.74 to $160.50.
The Chevron Corporation (NYSE: CVX) stock price is currently at $166.28 and has been in an uptrend since July 18 2023 while aiming toward the previous resistance level at $172.43. The stock price already took support from the $162.74 level but it seems like this level is not strong enough to hold the price above it, so the price will probably retrace toward $160.50.
On March 24 2023, the CVX stock price made a bullish impulsive move and recovered almost 13.59% of its value, after which the price dropped back to the support at $150.34 and started to consolidate between $160.50 to $150.34. During the consolidation phase, the price broke through the trend line and gained almost 8.76% in value until now.


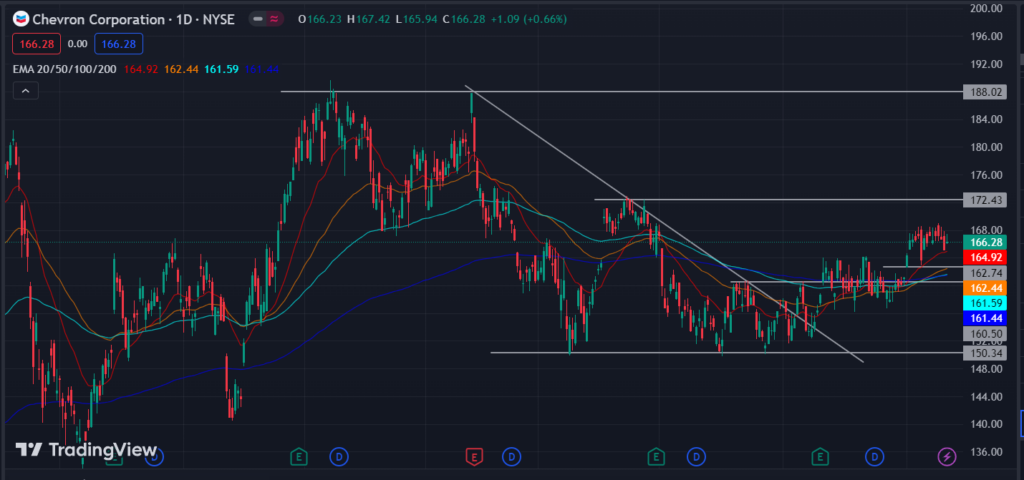
Now, the stock price is currently above the consolidation range, and the upper range at $160.50 will probably become the support level after which the stock price will aim to move toward $172.43.
The price action shows that the stock price is taking multiple supports at the same level, which means that $162.74 can become a significant level for the continuation of an uptrend.
Can Chevron Corp. Stock Price Break $188.02 level?
The Chevron Corporation stock price got rejected multiple times from the higher lows, which means that the bulls have more strength as compared to the bears in the current trading session. The bulls do not want the support to be taken by the bears and this is why they are showing strength at higher lows.
On a wider tame frame, the price is trading in uptrend so basically is a higher probability of the stock price going upward and while doing so it will strike the $188.02 level.
However, If the stock price breaks down the support at the $160.50 level, the bears will gain control and try to push the price down back to the $150.34 level.
Will the CVX Stock Price Strike $172.43 Level?
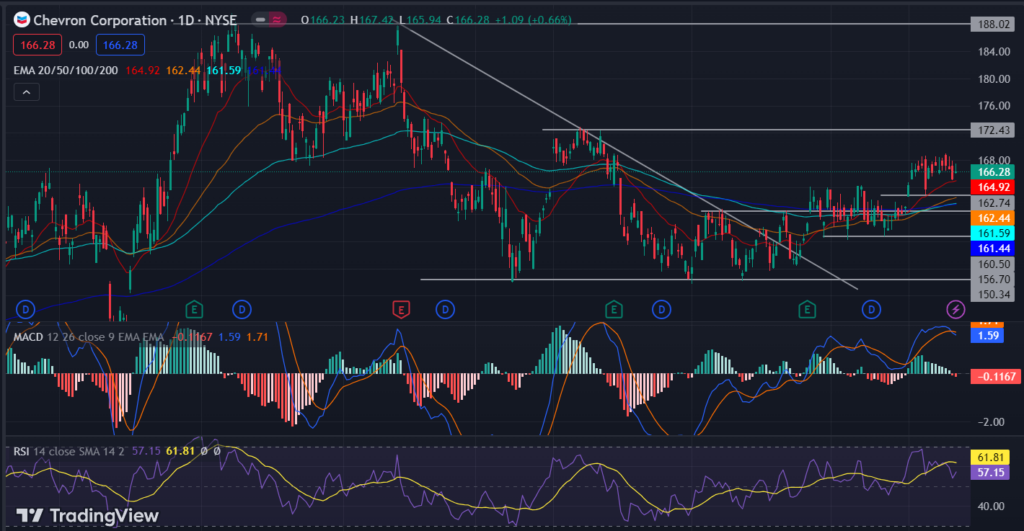
The stock price is trading above the 20, 50, 100 and 200-day EMAs, indicating the bullish momentum in the price. Although the last 3 candles were bearish, it doesn’t concern the direction of the stock price. The MACD has high volume on the bullish side with the MACD line at 1.59.
The RSI trades at 57.15 after facing rejection from 70.00. The upper band indicates the increase of bears in the market and is currently witnessing a short-term pullback to the $162.74 and $160.50 levels.
Technical Levels:
- Resistance Levels: $169.05 and $172.43
- Support Levels: $160.50 and $156.70
Disclaimer
The views and opinions stated by the author, or any people named in this article is for informational purposes only. They do not establish financial, investment or any other advice. Investing in or trading stocks comes with the risk of financial loss.


