

- The UNP stock is trading below the 50-day and 100-day Exponential Moving Averages.
- The RSI of the stock has shown that the stock has oversold.
The market capital of UNP stock -$124.396 billion
The current market price of the UNP stock -$204.11


Union Pacific Corporation Stock Synopsis
The UNP stock price has been falling rapidly from the higher levels. The stock has eroded all the gains it made this year as the price has declined over 15% in just 2 months. The overall return in 1 year for this stock is now at 2.95%, which is nominal. Its price has declined by over 3% in a week and over 9% in a month. That shows the bears have taken control over the price.
The net debt of the company has risen significantly from $13.67 Billion in 2016 to $33.93 Billion in 2022. A rise of over 148% in 6 years is an alarming sign for the company. This company needs to take some corrective action before the debt burden increases to an extreme level. The company paid a dividend of $5.08 in the previous financial year with a dividend yield of 2.45% which is adequate.
If we consider the net profit of the company, then it has risen slightly from $4.23 Billion in 2016 to $7 billion in 2022. However, the company has reported a net profit for two consecutive years, which is a good sign for the future of the company. The total revenue of the company has risen from $19.94 billion to $24.88 Billion and that’s adequate growth.
UNP Stock Technical Analysis
The price of stock is showing a strong downward momentum from the Resistance level 1 shown in the chart which is present near the $235 level. Currently, the price is taking support from the rising trendline, which is present near the psychological level of $200. The price has shown some strength as the price has taken support and ended the day in the green.
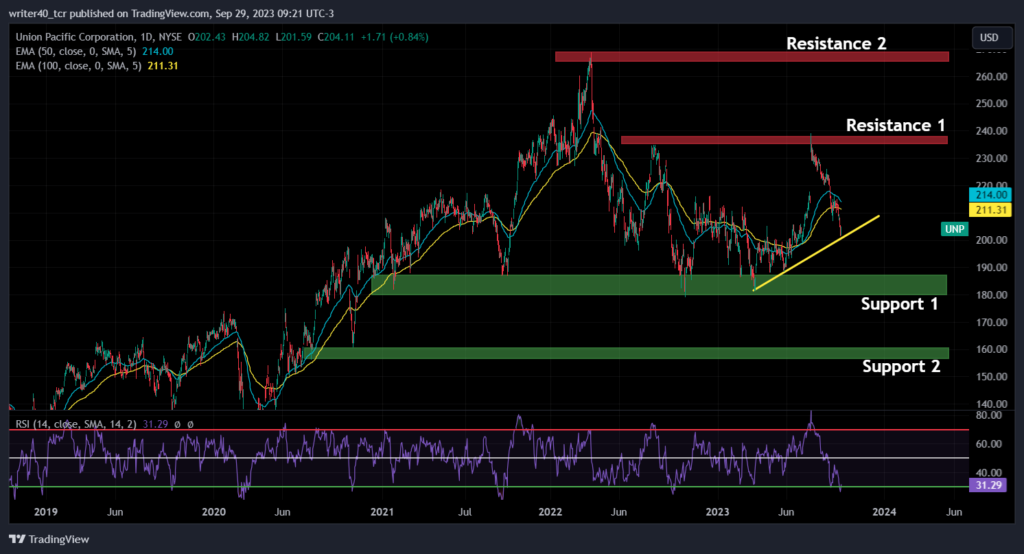
The resistance level for the price is present at the $235 and $265 level, which is drawn on the chart as Resistance 1 and Resistance 2 respectively. The support level is present near $188 and the $160 level, marked as support 1 and support 2 respectively. The price is currently trading below the 50-day and 100-day Exponential Moving Averages, which is a bearish sign. The RSI is very close to an oversold trajectory indicating the selling should be halted here.
Conclusion
The UNP stock price is trading very close to its support level and the RSI is indicating that the price is oversold. The price can show some bounce from here from the trendline. If the price breaks the trendline on the downside, it can fall to the level of $188. If the price rises from this level, a major resistance for the stock is present at the $235 level.
Technical Level
Resistance – $235 and $265
Support – $188 and $160
Disclaimer
The views and opinions stated by the author, or any people named in this article, are for informational purposes only. They do not establish financial, investment, or other advice. Investing in or trading crypto assets comes with a risk of financial loss.


