

- The ADA coin price has melted down over 92% from its all-time high of $3.1010, created in September 2021.
- The price has fallen by more than 44% in a year.
Market Capitalization of Cardano – $8.584
The current market price of Cardano – $0.2453


Cardano Coin Overview
In the ongoing session, the Cardano’s price is trading with a slight rise of $0.0004 or 0.16%. The price has declined by more than 2% in a week, 8% in a month, and 44% in a year. It signifies that the price is in a strong downtrend and bears are aggressively selling the asset on every rise. ADA coin’s price has declined by over 92% from its all-time high.
The Cardano coin price has been trading in a range of bearish candles, which it made on 17th August 2023. The Coin is facing difficulty in crossing this range, as it is not able to close outside the range of that candle. It is consolidating in a very short range. Essentially, the price has become less volatile now. Both buyers and sellers are trying hard to dominate each other.
Technical Analysis of Cardano Coin
The coin price is forming a downward-sloping trendline. The resistance of that trendline is present near the price of $0.342. It is marked as Trendline resistance on the chart and is drawn in yellow. The coin price has formed a support near the $0.2372 level, which is marked as support 1 on the chart given below.
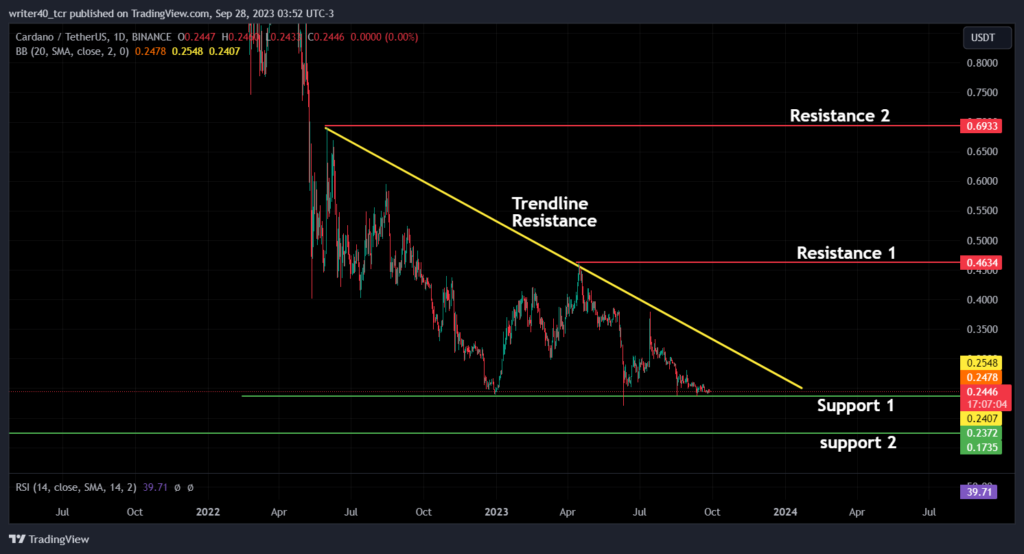
The resistance level (apart from the trendline resistance) is present at the price of $0.4634 and is marked as resistance 1 on the chart. Another resistance level is present at the $0.6933 level (Resistance 2). The coin can take a support near the price of $0.1735, which is marked as Support 2. The descending triangle pattern that the coin has formed shows that sellers are aggressively declining the price and the buyers failed to hold the higher levels.
What Does the Bollinger Band Indicator Reveal About the Price
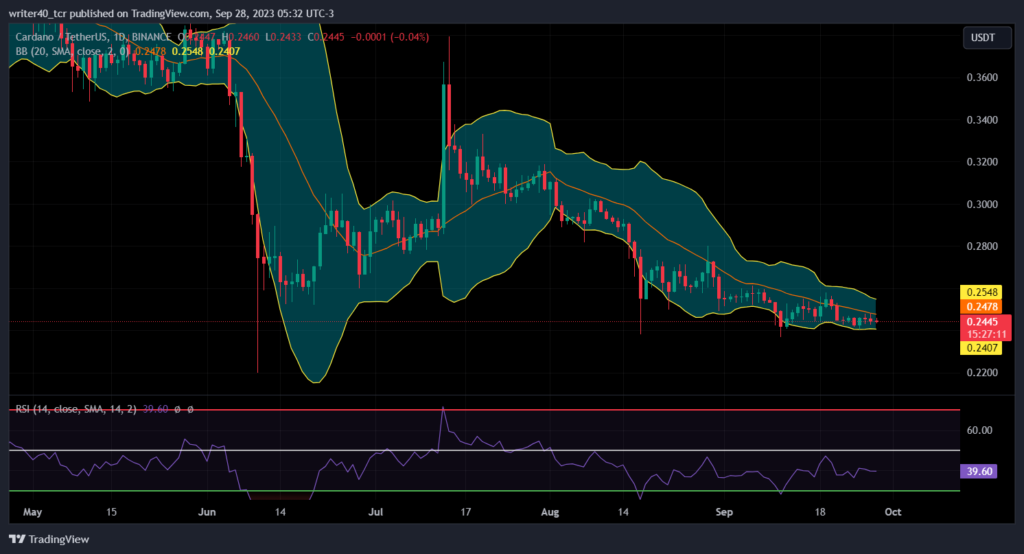
The Bollinger Band indicator has been squeezed at the present time, which indicates that the pierce has become less volatile now. In the upcoming days, the coin can show a massive move on either sides. The Relative Strength Index (RSI) is currently placed at 39.60 and the curve is flat. It shows that there is no such extraordinary move happening in this coin.
Conclusion
The token’s price is trading flat near the support zone and the Bollinger Band is also squeezed, indicating the coin is lacking volatility. The Bollinger band formation states that the price is preparing to show good volatility. If the price breaks the trendline resistance, it can move towards the level of $0.4634. Suppose it breaks the support level of $0.2372, it can try to achieve the $0.1735 level.
Technical levels
Resistance – $0.4634 AND $0.6933
Support – $0.2372 AND $0.1735
Disclaimer
The views and opinions stated by the author, or any people named in this article, are for informational purposes only. They do not establish financial, investment, or other advice. Investing in or trading crypto assets comes with a risk of financial loss.


