

- The INTU stock price is trading above the 50-day and 100-day Exponential Moving Averages.
- The INTU stock price is holding the $500 level strongly.
- INTU company’s revenue has shown Year-On-year growth in its previous quarters.
The market capital of the Intu’s stock – $143.196 Billion
The current market price of the Intu’s stock – $510.94


INTU Stock Synopsis
The INTU stock price in its last trading session showed a huge gap up opening, but as the day progressed the stock melted down the gains. It indicates that some active sellers are present in the stock, and they are pushing the price down. The price has declined by almost 5% in a month, which supports the above statement that the price is witnessing some selling pressure.
The INTU price has surged by over 21% in a year. This upward move could be triggered after the company posted a good financial report for the year 2023. The company increased its tally of revenue every year as it jumped from $5.18 Billion in 2017 to $14.37 Billion in 2022. The net income has also surged well from $0.97 Billion in 2017 to $2.38 Billion in 2022.
If we observe the net debt of the company, it has increased in the last 2 financial years (2022 and 2023). The company was in net cash surplus till 2021 and now the company has debt of $3.03 Billion. INTUIT’s management should take some corrective action to reduce the debt. If we examine the dividend, then the company has paid a dividend of $3.12 in FY 2023. It is not good for dividend-seeking investors.
Technical Analysis of the INTU Stock
If we observe the chart, the stock is currently in an uptrend as the price is trading above 50-day and 100-day Exponential Moving Averages. The stock has cleared out the crucial resistance zone of $490-$500. After the stock gave a breakout from this level, it jumped sharply toward the resistance level of $559-$572. That level is marked as Resistance 1 on the chart.
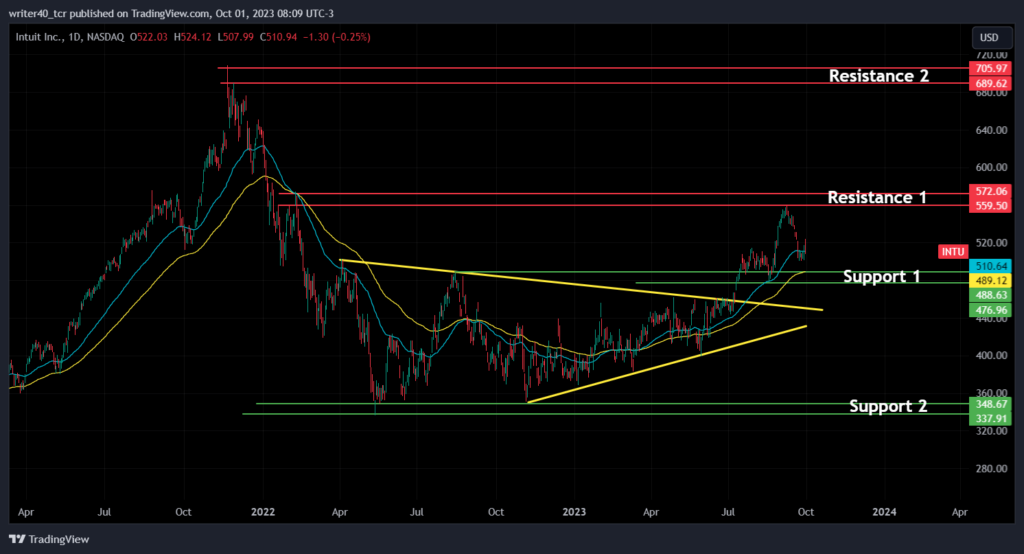
The stock price is taking support from the EMA levels, which are very close to the Support zone of $489-$476. Both the EMAs i.e. 50-day and 100-day, are present at $510 and $489 respectively. The price gave a breakout of the symmetrical triangle pattern and reacted strongly. The other resistance zone is present near the price of $689-$705. If we consider the support, it is present near $337-$348.
Conclusion
The price is in a strong uptrend and currently taking strong support from the EMA levels.
The financial performance of the company is getting better every year and that’s a good sign for the company’s future. If the price breaks the upper resistance level of $572, it can head toward the $689 level which is resistance 2. If the price breaks the lower level of $476, it can attempt to achieve the $348 level.
Technical levels
Resistance – $572 and $689
Support – $488 and $348
Disclaimer
The views and opinions stated by the author, or any people named in this article, are for informational purposes only. They do not establish financial, investment, or other advice. Investing in or trading crypto assets comes with a risk of financial loss.


