

- The GALA token is presently bearish and has created a falling channel pattern.
- It is currently trading at $0.0141 with an intraday rise of 1.04%.
- The token is down from its all-time high by 98.3%.
GALA token has been recording remarkable losses of 65.06% in the last 6 months and 44.30% in the last 3 months. The token marked its yearly high of $0.06295 at the end of January. After that, the price came down and has been bearish.
The price came down to the level of $0.021 from where the price took support and tried to move upside. It ended up getting rejected from the $0.029 range and creating a falling channel.


The token marked its all-time high on 26th Nov 2021, when the price was at the $0.8367 level.
It is currently trading with a surge in the trading volume by 102% in the past 24 hours. The market capitalization of the token is now at $348.44M. It has a present circulating supply of 24.49B GALA coins, which is only 48.99% of its total supply. The 24-hour trading volume of the token is $91.71M.
Sentiment Analysis
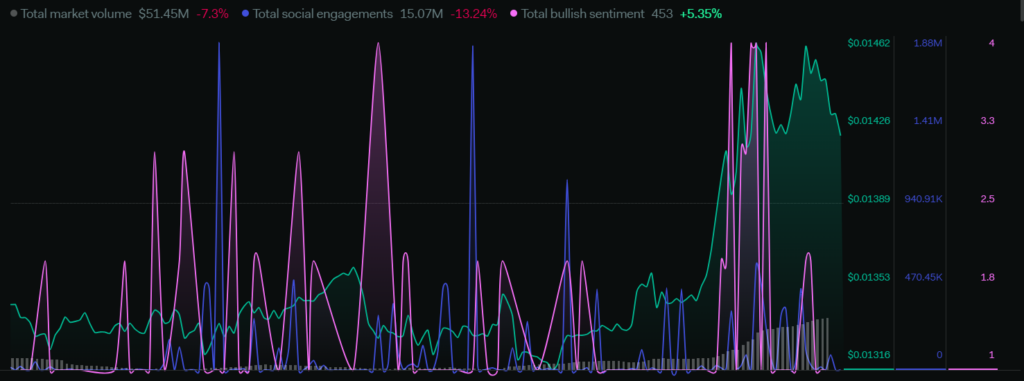
The total market volume has declined by 7.3% in the last 1 week. The total social engagements dropped by 13.24% and the total bullish sentiments increased by 5.3%. The overall sentiments are showing bearish sentiments in the market. The token is low in volume and the social community of the investors is not effectively engaging.
Technical Analysis (Daily- 1D)
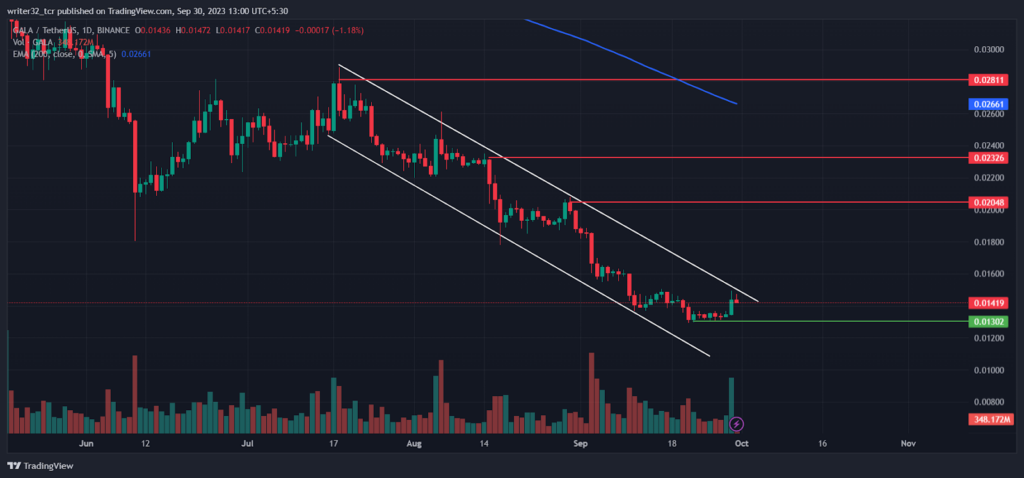
As we can see, the price tried to move in an uptrend but ended up falling and creating a falling channel pattern from where the token almost fell about 122%. The price has taken support from the level of $0.013.
The price after taking support has made a big green bullish candle. If in the next daily candle the price breaks the falling channel from above, it will be in a bullish scenario.
Also, If the price gets rejected from the top of the falling channel, it will continue its downtrend.
An important aspect to be noticed is the circulating supply of the token, which is currently a bit less than half of its total supply. It is considered to be a very low circulation of the tokens. If the circulating supply has to be increased, the investors and the social community have to be active and the bullish investors have to come into action and start the buying activity.

Relative Strength Index (RSI)
The RSI line is presently moving at 42.57 points and the SMA 14 is moving at 30.91 points. The RSI is currently below the neutral level of 50. RSI line bounced from the oversold region and it is presently trying to move above the neutral levels. Once the RSI reaches above the neutral level, the price will start recovering and move upside.
Moving Average Convergence/Divergence (MACD)
The fast blue line moving average is above the red slow line moving average. The volume of the histogram shows the increases in the volumes of the token, which is a positive sign for the price to make an upward move.
GALA LIVE CHART :
Conclusion
We should wait for the price to give a breakout from the top of the falling channel. If the price breaks out successfully, it can be bullish until the resistance of $0.020.
In an opposite scenario, if the price gets rejected from the top of the channel and starts to decline with a drop in the volumes, it will continue its bearish move and fall further.
Technical Levels
Support: $0.013
Resistance: $0.020, $0.023 and $0.028
Disclaimer
The views and opinions stated by the author, or any people named in this article, are for informational purposes only and do not establish financial, investment, or other advice. Investing in or trading crypto assets comes with a risk of financial loss.


