

- The UNI coin price is presently in a bearish trend.
- It is currently trading at $4.47 with an intraday surge of 4.3%.
- The token is down by 90.04% from its all-time high.
The price of the token created a yearly high of $7.6 from where the price started a downtrend and reached the level of $4 support. From the support level, the price took support and started to move on a bullish trendline. After some time, the trendline was broken and the UNI coin price got bearish again and fell to the $4 support level.
The token marked its all-time high on 3rd May 2021, when the token was priced at $44.97.


The price is currently trading with a decline in the trading volume by 3.41% in the last 24 hours.
The present market capitalization of the token is $2.58B. The market cap has increased by 4.16% in the last 1 day. It has a current circulating supply of 577.50M UNI which is 57.75% of its total volume. The 24-hour trading volume of the token is $79.41M.
Sentiment Analysis
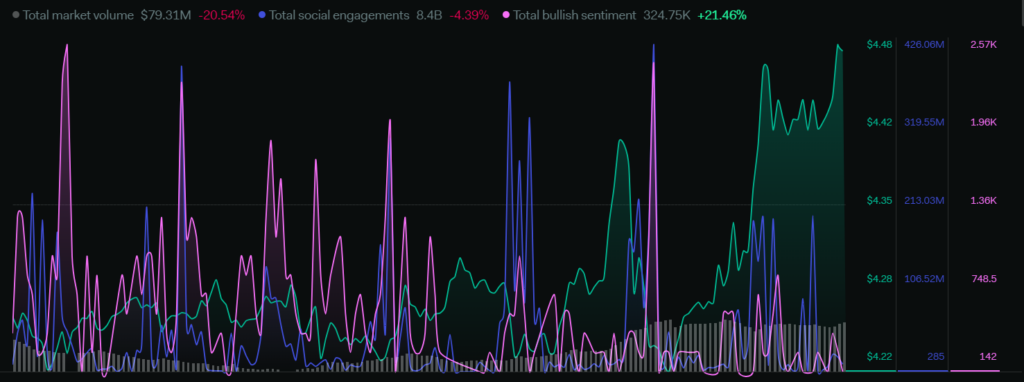
The total market volume of the token has declined by 20.54% in a week. The total social engagements decreased by 4.39% and the total bullish sentiments also grew by 21.46%. The social community is inactive and the weekly volume of the token is in a declining zone. So, the token’s overall sentiments indicate a bearish move in the price of the token.
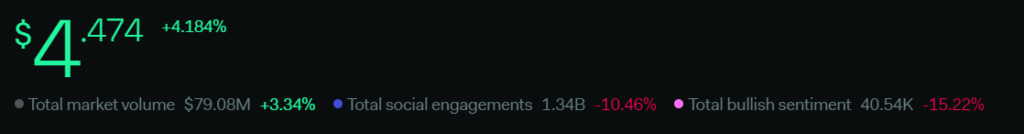
The daily sentiments are showing an increase in the total volume by 3.34%. The social engagements declined by 10.46% in a day. This coin’s bullish sentiments also decreased by 15.22%.
Technical Analysis (Daily – 1D)
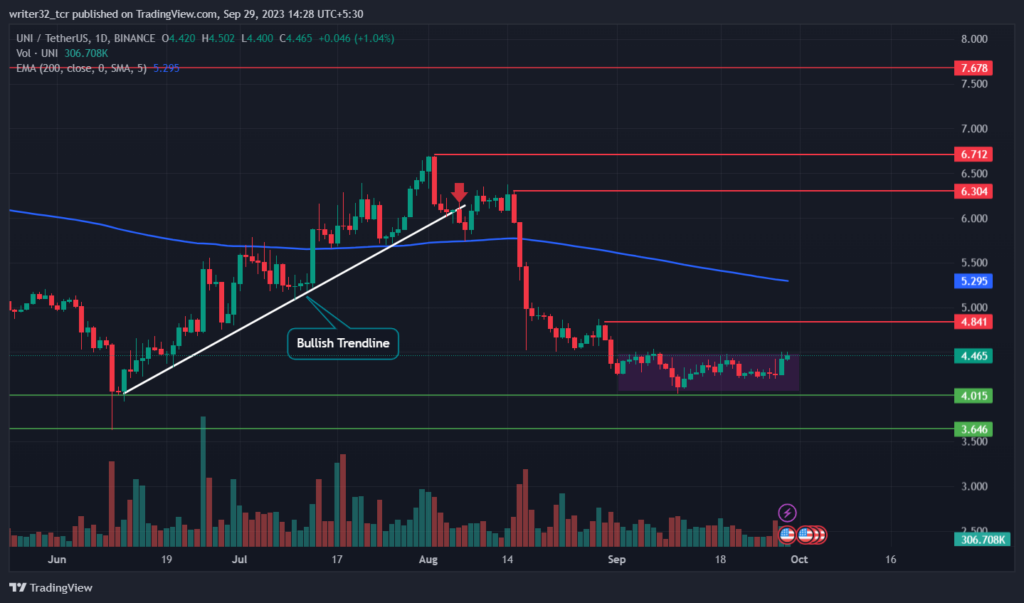
UNI token’s price is presently moving between the levels of $4 to $4.5, giving a little sideways movement to the price. From this level, the price has to break the $4.8 range to get a major upside to the level of $6.3.
Suppose the price gets rejected from the last lower low, it can fall again to the $4 level or the $3 level.

Relative Strength Index (RSI)
The RSI line is presently moving at 55.49 points and the SMA 14 is moving at 47.90 points. It is currently above the neutral level of 50. An RSI above 60 can indicate an upside movement in the price.
Moving Average Convergence/Divergence (MACD)
The fast blue line moving average is above the red slow line moving average. The volumes in the histogram are showing a bit increase in the volume, but we need a major increase in the volume for an upward movement in the price.
UNI LIVE CHART
Conclusion
The price of UNI coin has to get above $4.5 and it has to break above its last lower of $4.8 with a sizable volume so that it can get a major upward movement.
If the volume stays the same, the UNI coin price may continue its sideways movement. Suppose the volume decreases, we can fall to the support level of $4 again and if the price breaks the $4 support, the next support is at $3.6.
Technical Levels:
Support: $4 and $3.6
Resistance: $4.8, $6.3, $6.7 and $7.6
Disclaimer :
The views and opinions stated by the author, or any people named in this article, are for informational purposes only and do not establish financial, investment, or other advice. Investing in or trading crypto assets comes with a risk of financial loss.


