

- The price has faced a decline of 5.57% in the last 8 trading sessions.
- The price is continuing its bullish rally inside the parallel channel.
Berkshire Hathaway, Inc. (BRK.A): Technical Analysis
The BRK.A stock price is at $531477.00 and has faced a decline of 5.57% in the last 8 days. The company’s current market capitalization is valued at $764.518 billion. The stock trades with a 10-day average volume of $8.219K.
Over the last 7 days, the Insurance industry has remained flat. Consequently, the BRK.A stock price has been affected and has fallen.


Technical Analysis on 1-Day Chart
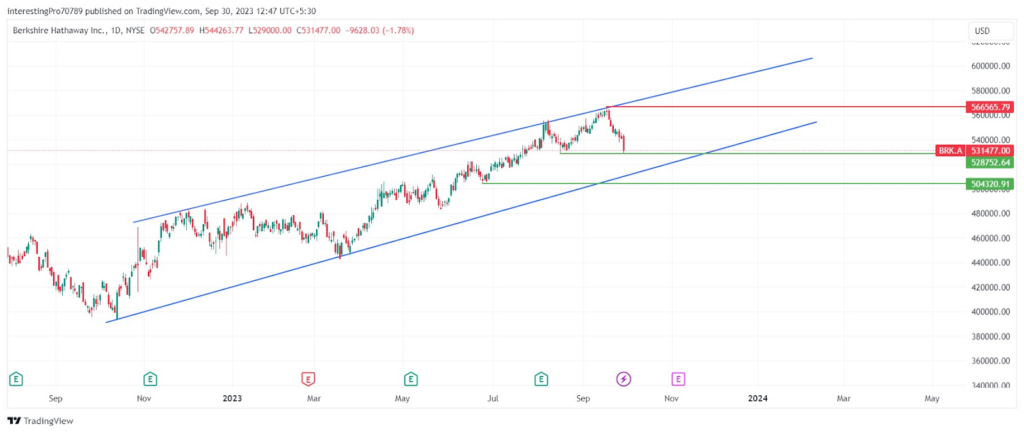
On the 1-day chart, the BRK.A stock price is inside a parallel channel after the price fell from its all-time high of $537370.50. The price is commencing a bullish rally and is moving up by forming higher highs and higher lows.
Recently, the price broke above its previous all-time high and has created a new one at $566569.97. Recently, the price has fallen from its all-time high and is sustaining above its $528752.64 support level. The fall in price can also be considered a profit-booking scenario, as the buyers who have invested at the bottom of the rally would surely be booking their profit.
If the price fails to sustain above $528752.64, it could be seen falling and taking support from the lower trendline of the parallel channel. This could be a great opportunity for buyers who want to invest their money, as the buy-on dip has been going on since the start of the bullish rally. If the price forms a strong bullish reversal candle, then the price would be seen continuing its bullish trend and can even retest its all-time high again.
Technical Indicators on the Current Trend
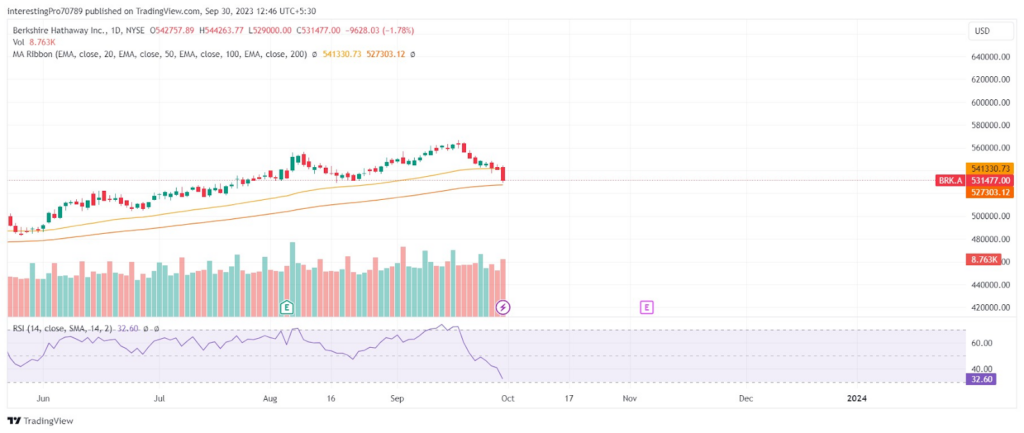
The BRK.A stock price is trading between the 50 and 100 EMAs. This indicates the indecisive nature of the price in the current scenario. However, the price could be seen taking support from the 100 EMA as it is just below the price.
The RSI line is below 50 and is falling towards the oversold territory. The RSI is in bearish territory and if the RSI line enters the oversold territory, a short-term recovery in the price can be seen.
The volume bar has spiked in almost every trading session, showing the strength of the movement in the price.
Conclusion
The overall trend of the BRK.A price is bullish. The price is currently falling after creating its all-time high of $566569.97 and is sustaining above $528752.64. If the price breaks below $528752.64 then the price could be seen falling to the lower trendline of the parallel channel. However, if the price formed a strong bullish candle at the trendline, then the price can be seen retesting its all-time high again.
Technical levels
Resistance levels: $566569.97.
Support levels: $528752.64.
Disclaimer
The views and opinions stated by the author, or any people named in this article, are for informational purposes only. They do not establish financial, investment, or other advice. Investing or trading comes with a risk of financial loss.


