

- The Kellanova stock has declined by over 4% in a week.
- The Kellanova stock has breached the critical support level of $53.
- BNP Paribas upgraded the rating of the stock to neutral from underperform.
The current market price of the Kellanova Stock- $ 52.99
The K stock price is in a strong downtrend as the price has continuously fallen since the beginning of this year. The price has fallen by over 19% in a year, which confirms its bad performance. The stock price witnessed the biggest fall of the year 2023 in the 2nd trading session. This fall happened after multiple rating firms including Goldman Sachs had given a sell rating on the stock.


Kellanova’s revenue has shown a slight surge (YOY) in revenue in the previous two quarters. If we examine the Net income of the company, it has declined by over 29% (YOY) in Q1 2023. It has jumped by over 9% (YOY) in Q2. However, the stock has turned profitable in Q1 2023, after reporting a net loss in Q4 2022.
The K stock’s management has to take some corrective action, as the net debt of the company currently stands at $6.87 Billion. However the company has managed to restrict the net debt on the range. It is still considered to be a high-debt company. The debt-to-equity ratio is 1.85%, which indicates that the company is at risk. Kellanova company has paid a dividend of $2.34 with a dividend yield of 3.28% which is adequate.
What Does the Kellanova Stock Chart Reveal?
The K stock’s price has shown a massive decline in the last 2 months. The stock price has recently broken the important support level of $53 which is now acting as a resistance. The price has tested that level and it seems that some sellers are present at this level. If we observe the chart, we can see the price has formed a declining trendline but it is present at the $64 level.
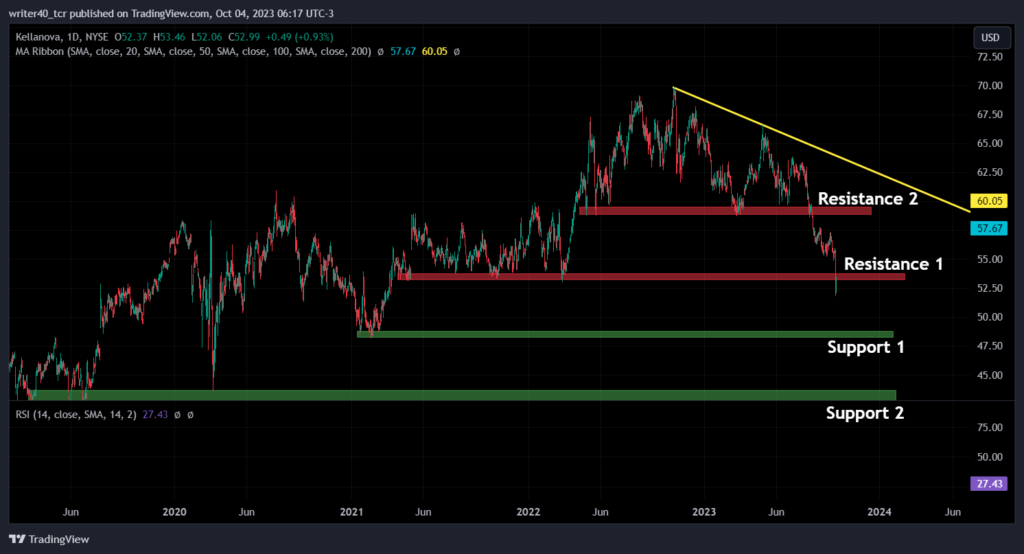
The stock price has breached the support level and the next support area is present near the $48 and $43.5 level. Those levels are marked as support 1 and support 2 respectively on the chart. Apart from the $53 level, the next resistance is present near the area of the $58 level.
A Close Look at the Indicators
Exponential Moving Average
The Kellanova stock price is trading below the 50-day and 100-day Exponential Moving Averages. That indicates the price is heavily bearish, and the slope of the EMA is down which confirms the above statement. Both the EMAs i.e. 50-day and 100-day are present at $57.67 and $60.09 Levels.
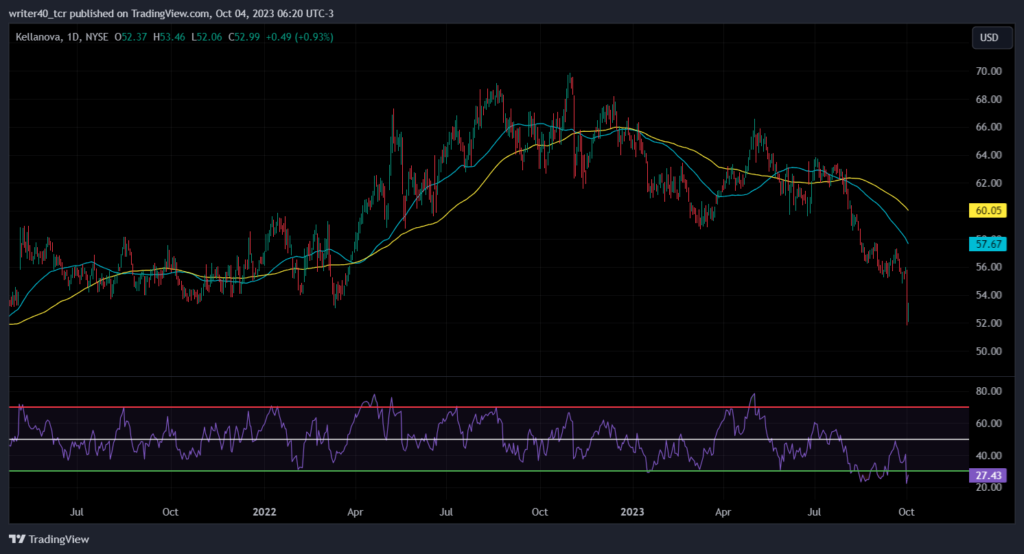
Relative Strength Index
The Relative strength index shows that the price is currently oversold and the price should halt the selling for some time. The RSI is sloping downwards which shows that the price is favouring the bears.
Conclusion
Kellanova’s stock price is currently facing a strong sell-off from the upper level and the price has breached the crucial support level of $53. The RSI is currently oversold, which can halt the selling for some time. However, it seems that the price can see more downside levels in future. The price can head toward the level of $48. If the stock traps the sellers and rises from this level, it can face rejection from either EMA or at the $58 level.
Technical level
Resistance – $53 and $58
Support – $48 and $43.5
Disclaimer
The views and opinions stated by the author, or any people named in this article, are for informational purposes only. They do not establish financial, investment, or other advice. Investing in or trading crypto assets comes with a risk of financial loss.


