

- The stock price has dropped more than 50% from the supply zone, since September 20, 2023.
- The 50-day EMA recently had a bearish crossover with the 200-day EMA. It signifies the selling pressure.
LanzaTech Global, Inc. (NASDAQ: LNZA) is listed on the American stock exchange and was founded in 2005. It provides carbon cycling technology, which converts pollutants to various products. The company transforms waste carbon into materials, such as sustainable fuel, fabrics, and other products.
Market Performance of the Company Stock
The stock price has declined by -5.77% during the intraday trading session. The price is currently trading at the $3.92 level with an exchange volume of 856.759K shares. The LNZA stock price had closed at $3.92 on the previous day. It had the annual high and low price level at $10.8 and $2.63. The total market capitalization of the LNZA stock stands at $767,044,048 with an average trading volume of $502,360 shares.


Technical Analysis and Price Prediction of LNZA Stock
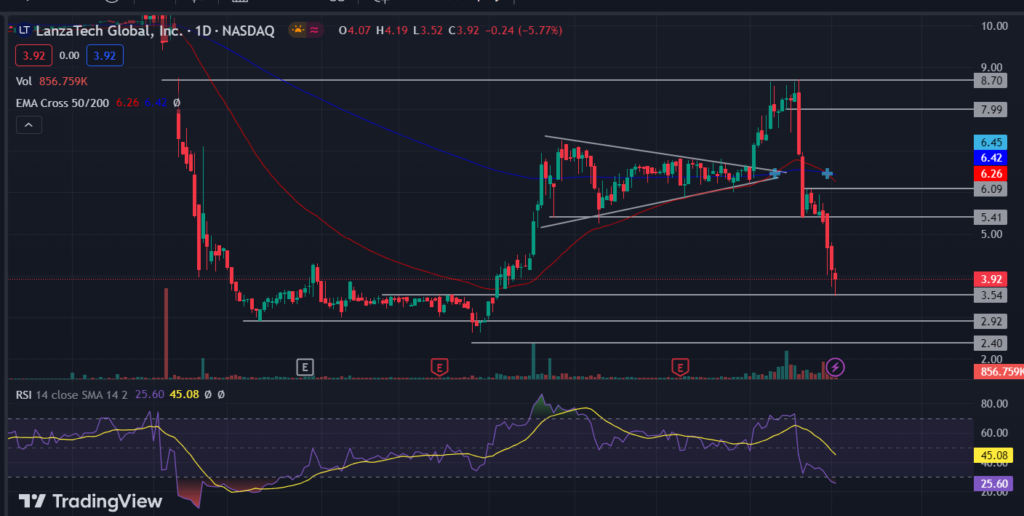
The LNZA stock price has seen a downfall of more than 50% from the supply zone, since September 20, 2023. The 50-day EMA made a bearish crossover with the 200-day EMA, since the last three trading sessions. Both the EMAs are coming in negative trends, which indicates the bears have taken control over the current price momentum. At present time, the 50-day EMA is at the level of $6.26 while the 200-day EMA is at $6.42.
In recent times as shown in the chart, the price created a flag pattern between $5.41 and $7.26 level. The price gave a breakout of the flag pattern and formed several bullish impulsive candles. The $8.70 level is a major resistance that successfully rejected the bulls. LNZA stock’s price is moving in a negative direction at $3.92, dropped from the last supply zone at the $5.41 level. It is retesting the $3.54 immediate support level, which can possibly reverse the price trend.
Furthermore, the relative strength index (RSI) trades at 25.60 in a downtrend, after the bearish crossover of the moving average. The RSI line is sloping in the oversold region, below the 30-mark lower band. It indicates the possible end of bearish momentum.
Conclusion
The LNZA stock price prediction will be bearish if the price closes below $2.92. However, for the price to get bullish once again, it should give respect to its demand level between $3.54 and 2.92 levels. After that, the price may rise to its major resistance at the $8.70 level.
Technical levels
- Resistance Levels: $6.09 and $8.70
- Support Levels: $2.92 and $2.40
Disclaimer
The views and opinions stated by the author, or any people named in this article, are for informational purposes only. They do not establish financial, investment, or any other advice. Investing in or trading stocks comes with the risk of financial loss.


