

- The stock price has formed a bullish engulfing candle while taking support from the important support level at $95.31.
- The Relative strength index (RSI) indicates a strong bearish momentum.
Novartis AG (NVS) is a Swiss multinational pharmaceutical corporation founded on February 29, 1996. It is one of the largest pharmaceutical companies in the world, consistently ranking in the global top five. The company uses innovative science and digital technology to create transformative treatments worldwide.
A Short Overview of the Company Financials
Fundamentally, the company had performed average in the last year as compared to the past few years. In the last year, the company reported its total asset value at $117.45 Billion which is -10.88% less than the year 2021.


According to the quarterly data, the company has generated a total revenue of $13.94 Billion in the month of June 2023. In comparison to the previous year’s quarter, the revenue has increased by 6.50%.
However, after the end of the quarter, the stock price of the company has risen more than 12%. This statement shows the sentiments of buyers in the market. Now, the stock price is halting in the demand area and also, the third quarter has ended.
Novartis AG (NVS) holds the current market capitalization of $203,800,410,831 with an average volume of 1,763,685.
Technical Analysis and Price Prediction of the NVS Stock
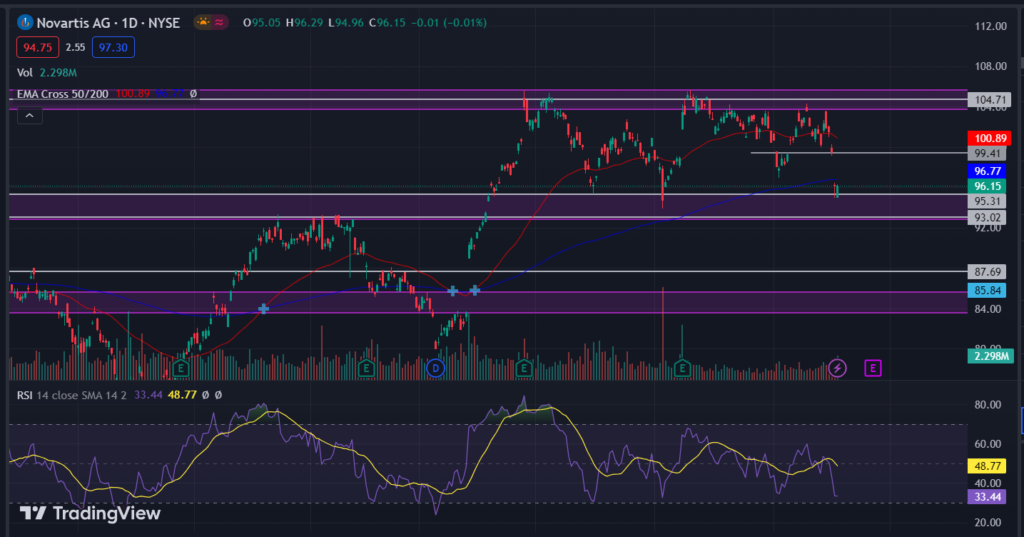
The NVS stock price is trading in a bullish trend. The 50-day EMA is at the level of $100.89. It made the last bullish crossover with the 200-day EMA in the month of March, since then, the price has gained almost 11.72% of its value. Now, the price is trading below both the EMAs, which could be a sign of a bullish reversal.
The price just took support from the $95.31 level and formed a bullish engulfing candle. According to the price action, this level will act as a demand area for the stock price. The NVS price is currently trading at $96.15 with a major resistance of $104.71.
On the other hand, the Relative strength index (RSI) line is sloping in a strong bearish momentum. It does not show any sign of divergence. The RSI strength is at the 33.44 range near the 30-mark lower band.
Conclusion
The NVS stock price is trading in an uptrend within the wide range between $104.71 and $93.02. The price prediction for the stock at current is bullish because the price is trading in the demand area. So, if the price breaks above the $99.41 level then, it may be seen rising up to $104.71 major resistance.
Technical Levels
- Resistance Levels: $99.41 and $104.71
- Support Levels: $93.02 and $87.69
Disclaimer
The views and opinions stated by the author, or any person named in this article, are for informational purposes only. They do not establish financial, investment or any other advice. Investing and trading in the stock market comes with the risk of financial loss.


