

- WBTC was founded on 26 October 2018 but it was released on 1 January 2019. Its use lies in Decentralized Finance (DeFi).
- It allows smart contracts and applications on the ETH blockchain to interact with cryptocurrency that is supported by real BTC reserves.
- It is a digital asset that bridges the gap between traditional finance and decentralized cryptocurrency.
The Market Capitalization of WBTC is $4,509,962,858. Its Total Supply is 163,084 WBTC. The Current Market Supply of WBTC is 163,084 WBTC.
Its trading volume in the 24 hours is $200,266,695. The Market Cap increased by 0.09%. All the data given in this article fluctuates due to market hours.


Technical Analysis of WBTC
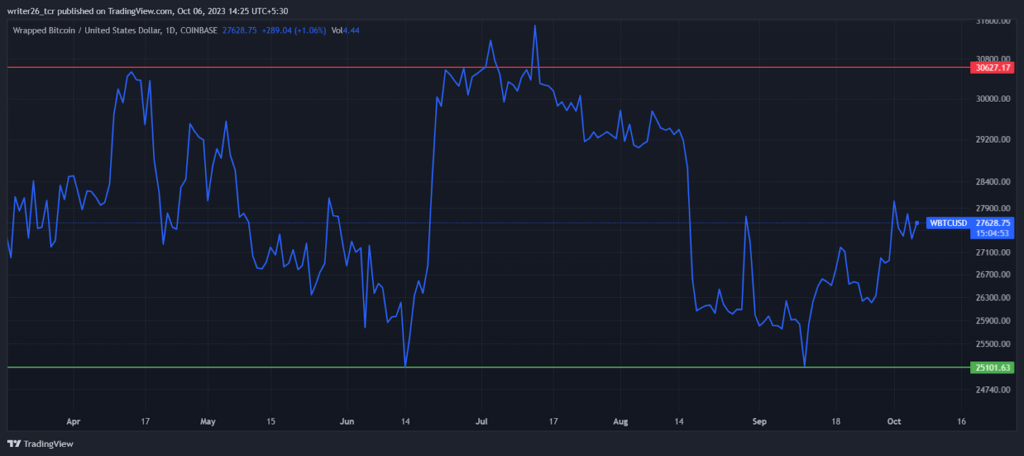
The chart indicates to us that the coin is moving in a sideways direction. Since April 2023, the coin has not performed well in the 1-D time frame. It is not able to break any level whether it is support or resistance. It will be cleared through candlestick charts only. In today’s session, it is up by 0.05%. Its ATH (All-Time High) was made on 10 November 2021, which was around $68977.
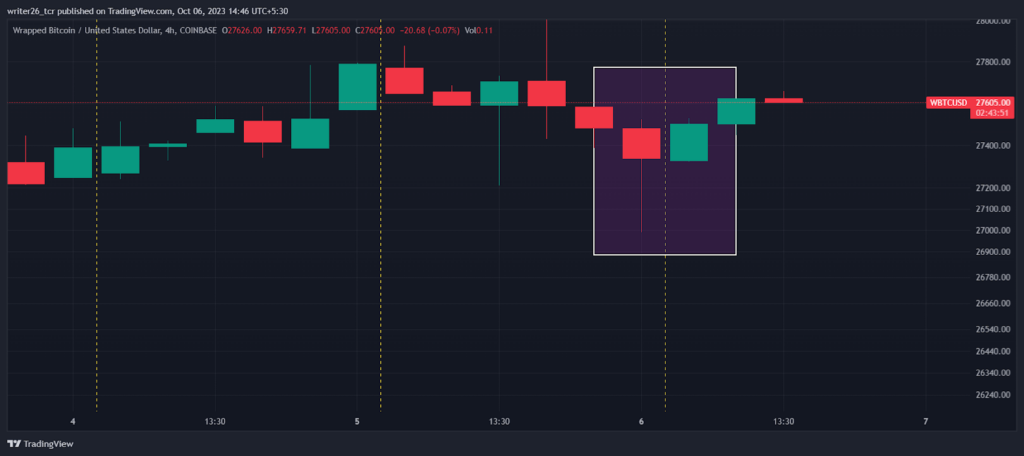
The candlestick pattern in the box confirms that the coin might continue to rise in the future. According to experts, the coin might rise by 7.19%%. It means it might reach the $29,699 price level by 11 October 2023. Its market sentiments are also bullish. The price-changing rate over the 30 days was around 2.27%. The coin made some good recovery in the past trading days from 12 September to 19 September 2023. The presence of bulls can be expected from the prediction of the coin. Essentially, the coin is up by 691.50%.
SMA and EMAs (50,100,200)
SMA 50- $26,466 (Buy) and EMA 50- $26,975 (BUY)
SMA 100- $27,943 (Sell) and EMA 100- $27,251 (Buy)
SMA 200- $27,937 (Sell) and EMA 200- $26,898 (Sell)
Live Chart of WBTC
Conclusion
As per the analysis, we can say that the stock is not performing well. It has been in a sideways position for a long time in a long-term time frame. It is also not suitable for the short-term duration because of its sideways momentum.
The analysis is done to provide technical information about the stock. It might carry its bullish momentum in the future according to predictions. In the 7-D time frame, it was up by 2.25%, and last month it was up by 7.42%. Last year, it was up by 37.41%.
The coin is not good for investors’ portfolios as it might not provide good returns to its investors in the future. It is a prediction that it will continue to go up in the upcoming trading session. The indicators and expert opinions are giving confirmation.
Technical Levels
Support level- $25,101
Resistance level- $30,627
Disclaimer
This is a general article that does not provide any financial information. Investors should focus on both technical analysis as well as fundamental analysis. The analysis is done to provide information to readers. To make them aware of investments.


