

- The V share has increased by 0.67% and is trading at $235.04.
- The VISA company plans to invest $100 Million in AI-based companies.
Visa Inc. (NYSE: V) is a multinational payment card service corporation. It provides digital payment services. It offers debit cards, prepaid products, commercial payment solutions, and global ATMs.
$100 Million Investment by VISA in AI Companies
Recently, the VISA has taken the initiative to invest $100 Million in the development of AI generative technologies and applications. This investment shows the payment giant’s commitment to shaping the future of commerce and the digital payment field.


VISA (V) Stock Price Analysis
In the last intraday session, the VISA stock increased by 0.64% and is trading at $235.04. The company’s current market capitalization is around 478.391 Billion USD. It trades with an average 10-day trading volume of 5.709.
The V Stock Price Showing Bullish Continuation Sign
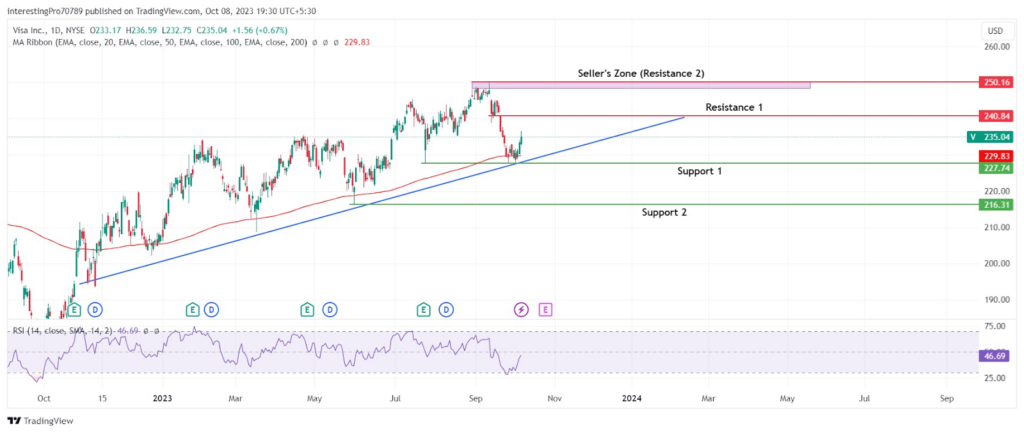
V Stock has been in a continuous uptrend since the end of 2022. The stock price is rising with the support of the trendline and a buy dip has been going on in the 1-day chart. Currently, the price has taken support from the trendline and the horizontal level of $227.74.
The price has recently taken support from the 200-day EMA and is currently rising. It indicates the V stock price is in control of buyers.
The RSI line is at 46.69 and is sloping in the downward direction. The RSI is currently at a neutral state, but the upward sloping of the RSI shows the buyers are influencing the price in the current scenario.
The V stock price has recently taken support from the trendline, horizontal level of $227.74, and the 200 EMA line. Currently, the price is rising and is approaching its 240.84 resistance. If the price breaks above this level, it may rise to the seller’s zone at $250.16.
The stock price can be in bearish sentiment if it closes below all three supports from which it has recently taken support. It will trigger the fall and the V stock will fall to its next support level at $216.31.
Conclusion
The overall trend of the V stock is bullish. The price has recently taken support from the trendline, horizontal level of $227.74, and from the 200 EMA line. It is currently rising after taking support from these three different supports and is approaching its immediate resistance at $240.84. If the price closes above this level, it may rise to its next resistance at $250.16.
However, if the price gives the breakdown of these three different supports, it may be seen falling to its next support at $216.31.
Technical levels
Resistance Levels: $240.87 and $250.16.
Support Levels: $227.27 and $216.31.
Disclaimer
The views and opinions stated by the author or any other person named in this article are for informational purposes only. They do not provide financial, investment, or other advice. Investing or trading comes with a risk of financial loss.


