

- KLAY has given a breakout from the top of the falling channel.
- It is currently trading at $0.119 with an intraday uprise of 1.18%.
- The token is down by 97.3% from the all-time high.
The KLAY token was trading in a falling channel and presently the price gave a breakout from the top of the channel. The price during trading in the channel reduced by 40%. Klaytn has recorded losses of 50.13% in the last 6 months. The token has recorded its yearly high of $0.375 in Feb.
The token marked its all-time high on 2nd April 2021, when it was priced at $4.38.


It is trading with an upsurge in trading volume by 25% in the last 24 hours.
The token has a market capitalization of $379.34 Million. It has a circulating supply of 3.17 Billion KLAY coins, which is 55.05% of its total supply. The 24-hour trading volume of the token is $13.67 Million.
Sentiment Analysis

The total market volume has increased by 80.16% in the last week. Total social engagements have surged by 52.27% and the total bullish sentiments have declined by 16.57%. The sentiments essentially suggest a positive movement as the interest of the community is growing and the volume is increasing.
Technical Analysis Of KLAY ( Daily – 1D )

The chart shows that the token was falling from a falling channel. The price went down to the $0.107 level and took support from there. The token then started moving upward and gave a bullish breakout from the top of the falling channel.
KLAY coin’s price is currently facing a rejection from the last lower low. It can come down and the breakout will be considered a false breakout if the price continues to fall.
The price has to break the resistance level of $0.133, which will confirm a bullish movement. If the bearish investors maintain their dominance at the resistance level and the volume starts falling down, the price may get bearish again.
Indicators About The Price Of the KLAY Coin
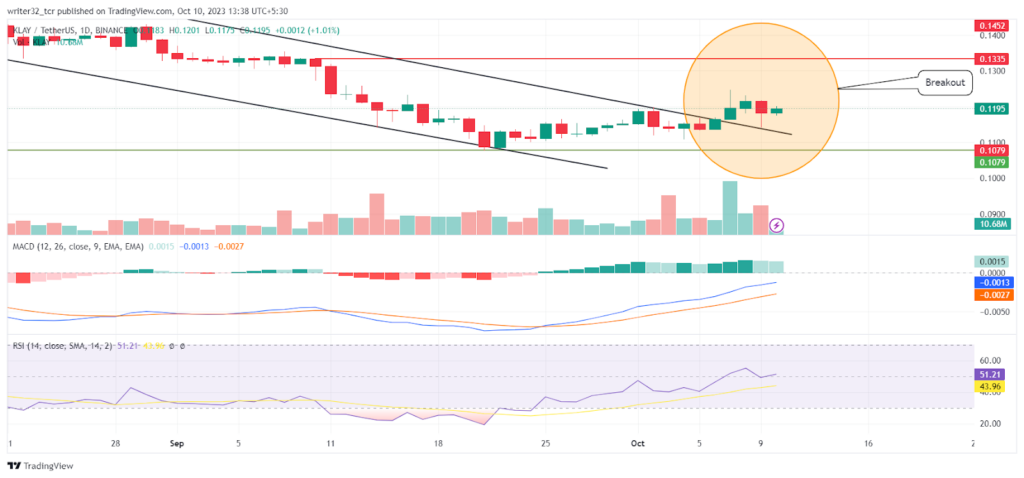
Relative Strength Index (RSI)
The RSI line is presently moving at 51.21 points and the SMA 14 is moving at 43.96 points. The RSI is above the neutral level of 50. From here if RSI moves upwards, the price can give a bullish move.
Moving Average Convergence/Divergence (MACD)
The fast blue line moving average is moving above the red slow line moving average. The histogram shows increasing volumes which is bullish for the price. However, the volume has to keep on surging significantly for a successful upward move.
KLAY LIVE CHART
Conclusion
On the basis of analysis, If the KLAY token breaks the resistance of $0.133, it will be a confirmation of an upward movement. Also, If the price falls down from the last lower low, the price can fall again to the level of $0.107.
Technical Levels
Support Level: $0.107
Resistance Level: $0.133, $0.145, $0.159
Disclaimer:
The views and opinions stated by the author, or any people named in this article, are for informational purposes only and do not establish financial, investment, or other advice. Investing in or trading crypto assets comes with a risk of financial loss.


