

- The price of LOOM is presently under a bullish trend.
- It is trading at $0.2121 with an upsurge of 10.91% in the last 24 hours.
- The token is down by 72.43% from the all-time high.
Loom Network is a platform as a service that is built on the Ethereum blockchain and enables developers to work on enormous decentralized applications. This network was released on October 1st, 2017.
The token has recorded an ROI of 222.94% in the last 6 months and 352.66% in the last 3 months. It is currently under a bullish trend and on its way to making a new yearly high.


It is trading with a rise of 20.05% in the daily trading volume.
The market capitalization of the token is $259.22 Million. It has a circulating supply of 1.21 Billion LOOM which is 93.80% of the total supply. The 24-hour trading volume of the token is 212.53 Million.
Sentiment Analysis
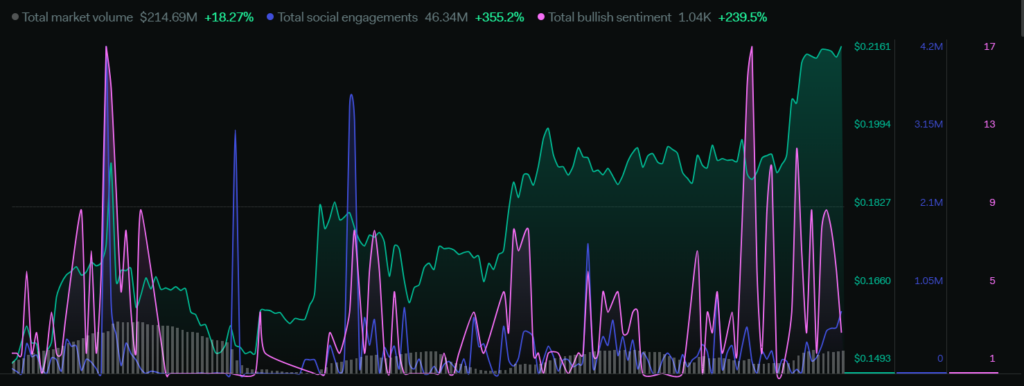
The total market volume of the token has surged by 18.27% in a week. Total social engagements have a growth of 355.2% and the total bullish sentiments have increased by 239%. Overall sentiments indicate a bullish movement in the price as all the aspects of the token are showing positivity.
Technical Analysis of LOOM (4Hr Time Frame)
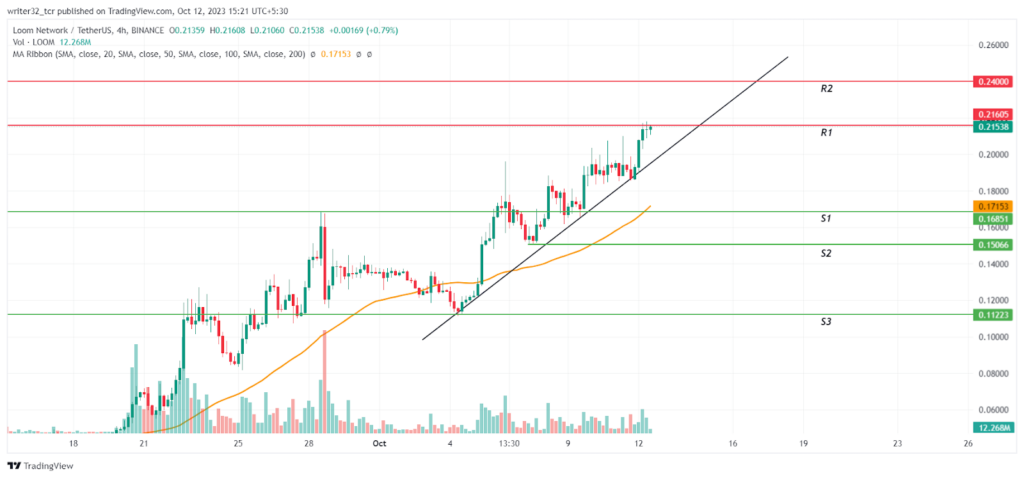
The chart of LOOM shows that after getting above the 50-day EMA the price started to move on a bullish trendline. It is presently trading near the resistance level of $0.21. The price can break this resistance easily as the volume of the token is increasing.
If the price gets rejected from the resistance of $0.21, will take support again from the trendline. The bulls are presently in the action of taking the price more upside, setting a new yearly high.
Also, if the price gets above the resistance of $0.21 and sustains and takes support from the trendline again then it can also break the roundoff resistance of $0.24.
However, Once the price breaks below the trendline and gets below the 50-day EMA and sustains then the price can start a bearish movement.
What Indicators Say About LOOM
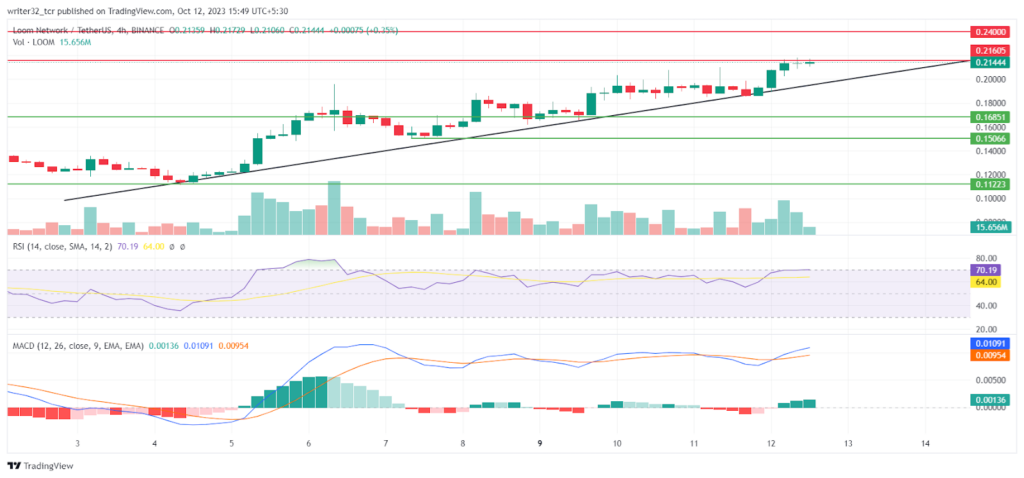
Relative Strength Index (RSI)
The RSI line is presently moving at 70.19 points and the SMA 14 is moving at 64.00 points. Both are above the neutral level of 50. The RSI has entered the overbought region and from here the bearish investors can anytime soon take entry into the market and the price can be bearish.
Moving Average Convergence/Divergence (MACD)
The fast blue line moving average is moving above the red slow line moving average.
The histogram shows hikes in the volume which is a bullish sign for the price.
LOOM LIVE CHART
Conclusion
The overall analysis of LOOM says that the token is under a bullish trend. Its volume is increasing and its price is moving on a bullish trendline. The price is considered to be bullish until it gets rejected from the resistance and brokes below the trendline.
Technical Levels
Support: $0.16, $0.15 and $0.11
Resistance: $0.21 and $0.24
Disclaimer:
The views and opinions stated by the author, or any people named in this article, are for informational purposes only and do not establish financial, investment, or other advice. Investing in or trading crypto assets comes with a risk of financial loss.


