- The MU share price is currently trading at $69.21.
- The company CEO has sold shares worth $486,774.
Micron Technology (NASDAQ: MU) is a system storage solution company. It produces computer memory and computer data storage units, including flash memory and USB flash drives.
Micron Technology CEO Sold Shares Worth $486,774.
According to Form 4 SEC filing, the CEO and president of Micron Technology (MU) sold shares worth $486,774 on 10 October 2023. 4 SEC reports show that Sanjay Mehrotra, the CEO of MU has a control over total of 1,184,257 shares. He held 582,862 shares directly and 601,257 shares indirectly. After this event happened the MU share price was down by 0.71% on this day.


Micron Technology (MU) Stock Analysis
The MU stock price closed its last intraday session at $69.21, where it declined by 0.77% in its last intraday session. It is a large-cap company with a market capitalization of 75.995 Billion USD.
1-Day Chart Price Analysis (MU)
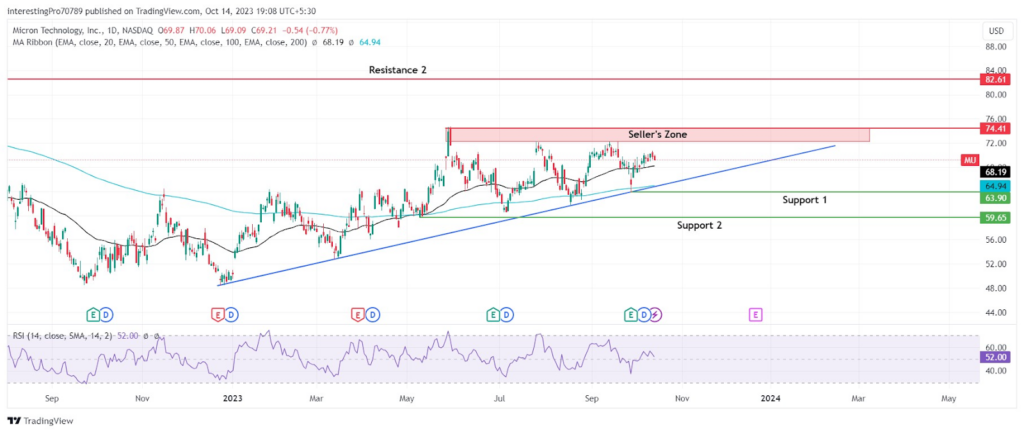
The MU stock price has been in a continuous uptrend since last December 2022 with support of ascending trendline. With a strong resistance of $74.71 level. The price is forming an ascending triangle pattern.
The price has recently taken support from the 50-day EMA as well as the 200-day EMA. Its EMA lines are also trading above the price. It shows the stronghold of buyers over the MU share price.
The relative strength index line is above 50-level, which is marked in bullish territory. However, it shows that there is some selling pressure which currently making the RSI line point in a downward direction.
In the current scenario, the price is trading just below the resistance zone of $74.41. Its overall trend is an uptrend. The EMA lines show the overall buyer’s presence. Only RSI is showing selling pressure is going on in the current scenario. Overall, the chart sentiment is showing a bullish market in the near future.
So, for the price to continue its overall uptrend, it should give the breakout of the $74.41 level. Thus, it may rise to its next resistance at $82.61. However, if the price breaks below the ascending trendline and the $63.90 level, it may fall to its next support at $59.65.
Conclusion
The Overall trend of the MU chart is bullish. The 1-day chart of MU shows that the overall price movement is controlled by the buyers. The price has recently taken support from the trendline and EMA lines. Only RSI is showing selling pressure going on in its bullish territory. So, now it must close above the $74.41 level to continue its further uptrend.
Technical levels
Resistance Levels: $74.41 and $82.61.
Support Levels: $63.90 and $59.65.
Disclaimer
The views and opinions stated by the author or any other person named in this article are for informational purposes only. They do not provide financial, investment, or other advice. Investing or trading comes with a risk of financial loss.


