
 Bitcoin
 Solana
 Pearl
Pearl Zerebro
 Aerodrome Finance
 LayerZero
 NEAR Protocol
- The price volatility of EGLD crypto was high at press time at 9.26%.
- MultiversX has 76% of its maximum supply circulating in the market.
The total value locked for EGLD is $112.96M, as per DefiLlama, and its stablecoins market cap is $13.38M.
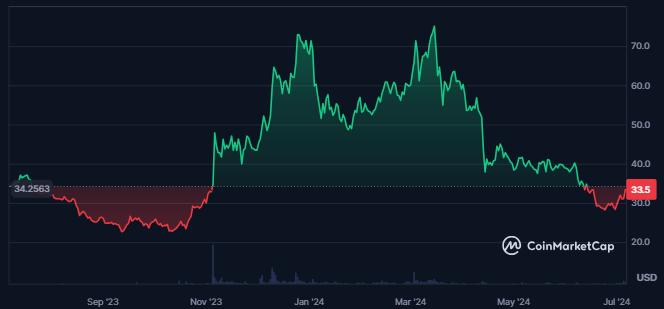
Price Overview Chart of EGLD | Source: CoinMarketCap
The market cap of MultiversX has advanced by 6.01% in 24 hours to the value of $906.794M.
When writing, MultiversX was the 68th largest cryptocurrency in the global cryptocurrency market. The traded volume for the crypto has witnessed a decline of 3.45% in 24 hours. It further results in a traded value of $63.101M.
What Does Derivatives Data Say About MultiverseX Crypto?
The derivatives traded volume for EGLD crypto has advanced by 19% in the last 24 hours to a value of $132.33M.
Also, a surge in the number of open positions for crypto can be seen as the open interest has advanced by 33%, which further results in $28.84M.

MultiverseX Crypto Derivatives Liquidation Chart | Source: Coinglass
Although the MultiversX crypto’s derivatives have been trading with lower volumes over time, it has started to advance to higher levels in the most recent times. It showed that the demand for crypto was rising.
The recorded short liquidation for the crypto is worth $185.14K, much higher than the longs liquidated in the last 24 hours. It showed the dominance of buyers in the crypto in the recent times.
EGLD Crypto Technical Analysis
EGLD crypto price has hit a crucial support level that has not been mitigated for the last eight months.
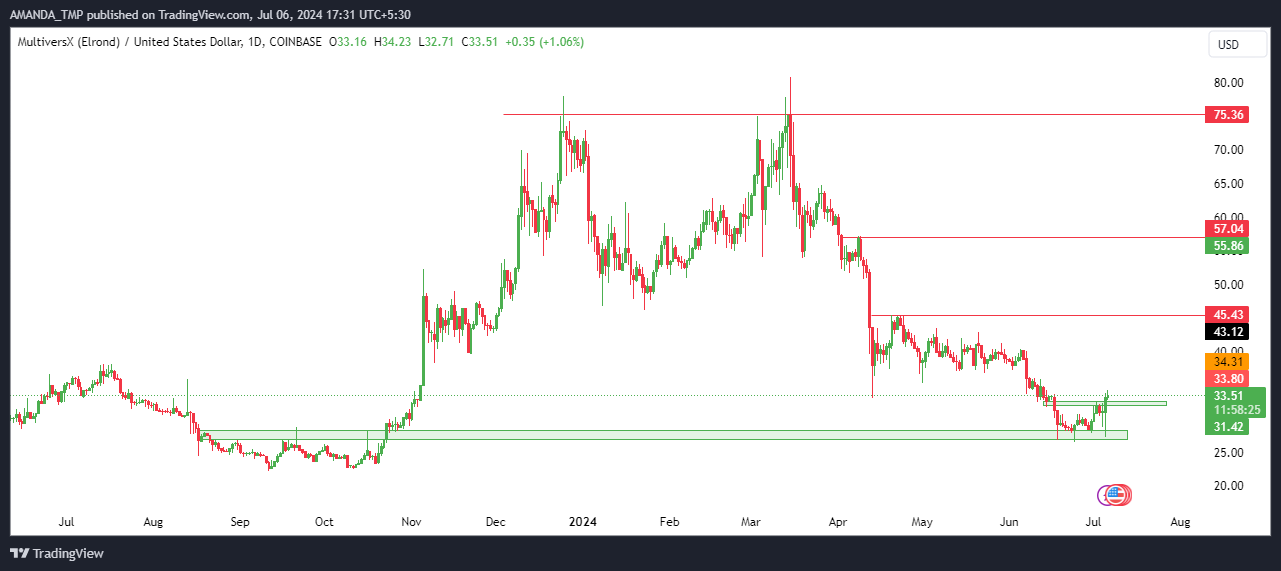
EGLD Crypto Daily Price Chart | Source: Tradingview
The price of the EGLD crypto consistently declined from the higher levels, followed by the formation of lower highs and lower lows on the charts.
From the swing high of $80.85 formed on 15th March 2024, the crypto price has lost its value by 65%. At press time, the crypto price has formed a bullish price action followed by bullish candlesticks at lower levels.
The crypto price took multiple rejections from the lower levels and broke above the most recent swing high of $33.0. It indicated that the price was gaining buyers’ support and might reach higher levels soon.
EGLD/USD Chart by TradingView.com
The EMAs traded in a death cross at press time, while EGLD crypto price broke above the 20-day EMA. It also hit the 50-day EMA, showing volatility and uncertainty in the price, as this behavior could lead to a retracement or a trend change in price.
The MACD metrics traded in negative territory but advanced from the lower levels. The histograms formed on the chart were bullish at the time of writing. The RSI broke above the 50 level and advanced above the 14-day SMA at press time. That showed a rise in the bullish momentum of the crypto.
Summary
EGLD Crypto price showed bullish signs, with a market cap increase of 6.01% and rising open interest in derivatives.
However, high volatility, a recent 65% decline from its March high, and mixed technical indicators, such as a potential death cross and bullish RSI, made its future uncertain despite recent support from buyers.
The support levels for the EGLD crypto are $22.0 and $26.00, followed by the resistance levels of $45.00 and $57.00.
Disclaimer
This article is for informational purposes only and does not provide any financial, investment, or other advice. The author or any people mentioned in this article are not responsible for any financial loss that may occur from investing in or trading. Please do your research before making any financial decisions.




