

- The FXS token has declined by $5.776.
- The token price has reclaimed the 50-day EMA and is sustaining above it.
Frax Share (FXS) is a non-stable utility token. It is an open-source and permissionless blockchain. It aims to provide highly scalable, decentralized, algorithmic money instead of fixed-supply digital assets like Bitcoin.
Frax Share (FXS) Price Analysis
The FXS price has declined by 0.35% and is at $5.776 at the time of writing. The token is currently trading with a volume of $146.18K and has an average 10-day trading volume of $473.672K. The FXS token has a market capitalization of $430,005,141 with a circulating supply of 74,576,873 FXS tokens.


1-Day Chart Price Analysis Of FXS Token
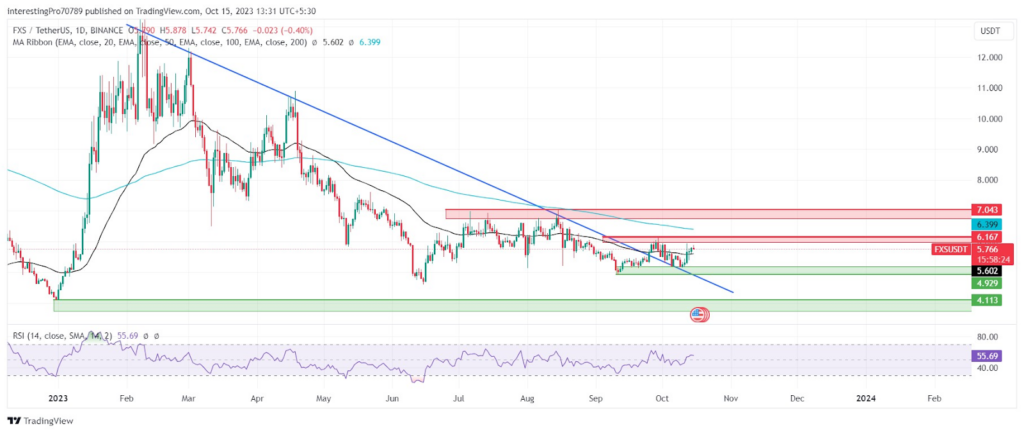
Recently, the FXS coin price has given the breakout of the descending trendline. It is currently rising after a pullback with the support of $4.929. Its price has increased by 10.97% since it took support from this level. Currently, it is moving to retest its resistance zone at $6.167.
The price has recently reclaimed the 50-day EMA and is sustaining above it, which is a bullish sign. Currently, it is showing bullish sentiments and could rise to test the 200-day EMA which is just above it.
The relative strength index (RSI) is at 55.66, which is marked as neutral territory. However, the RSI line is pointing in the upward direction, indicating the high buying pressure.
The price analysis of the FXS token shows that the price has bullish momentum. It has reclaimed the 50-day EMA. If the price gives a breakout of $6.167, then it could rise to its next resistance at $7.043.
However, for the price to fall, it must close below the 50-day EMA after which it may fall to its immediate support at $4.929. If it also gives the breakdown of the $4.929 support zone then it may fall to its next support at $4.113.
Conclusion
The FXS coin is showing bullish momentum with a positive indication from its technical indicators. The price has reclaimed the 50-day EMA and is trading above it. If the current candle loses above its previous candle, then it could add more buying pressure and could possibly test the $6.167 resistance level.
If the price also breaks above $6.167, then it would rise to its next resistance at $7.043. However, for the price to gain bearish momentum, it has to close below the 50-day EMA after which it would fall to its immediate support at $4.929. If it also breaks below this level, then it will fall to its next support at $4.113.
Technical levels
Resistance Levels: $6.167 and $7.043.
Support Levels: $4.929 and $4.113.
Disclaimer
The views and opinions stated by the author or any other person named in this article are for informational purposes only. They do not provide financial, investment, or other advice. Investing or trading in crypto comes with a risk of financial loss.


