

- The XEC coin price had given a breakout from the downtrend.
- It is trading at $0.0000247 with a decrease of 0.90% in the last 24 hours.
- The token is down by 95.84% from its all-time high.
The price of the token started a bearish trend after marking its yearly high. The price went down to $0.0000217 in the downtrend. After taking support from the level of $0.0000217, the price broke the bearish trend and entered a slight uptrend. It has recorded a negative ROI of 20.73% in the last 3 months.
The XEC token marked an all-time high on 10th November 2021, when it was priced at $0.0005926. The token is trading with an increase in the trading volume by 77% in the last 24 hours.


The present market capitalization of the token is 484.41 Million. It has a circulating supply of 1.95 Trillion XEC, which makes up 92.99% of the total supply. The 24-hour trading volume of the token is 31.22 Million.
Technical Analysis Of XEC (Daily-1D)
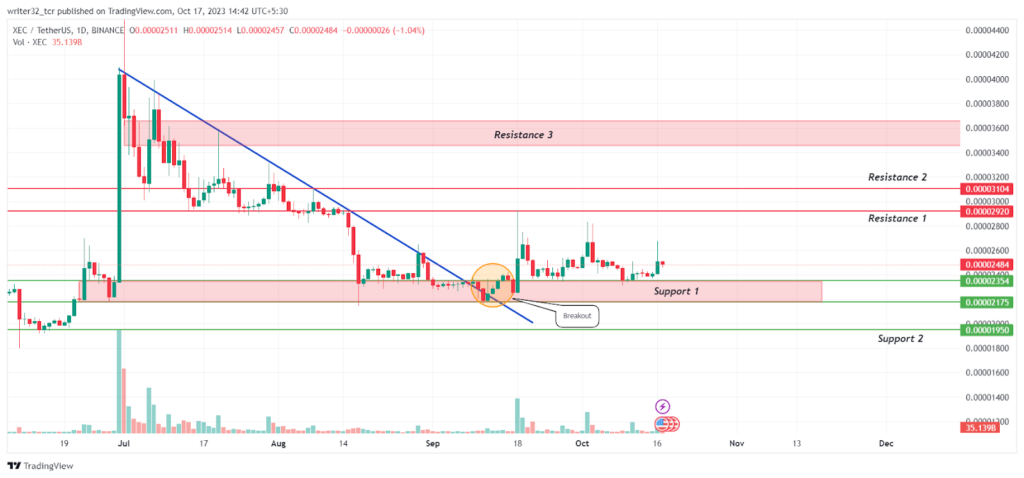
The XEC price was in a downtrend for almost 3 months. It is now trying to sustain above the 50-day EMA to stay in an uptrend and move higher. The price got rejected from the resistance level of $0.0000292 and after that, it started making lower lows.
If the XEC token price sustains above the 50-day EMA and the volume rises, the token’s price can gain bullish momentum and reach the $0.0000292 and $0.0000310 levels. Furthermore, If it breaks above the resistance level of $0.0000310 with a sizable volume, it can reach the $0.0000346 and $0.0000365 levels.
However, If the price falls below the 50-day EMA, it may again take support from the $0.0000217 to $0.0000235 support levels. The price can fall even lower if it breaks down from the support level of $0.0000217 with a low volume. In such a scenario, the next support level would be at $0.0000195.
What Indicators Say About the XEC Price
Relative Strength Index (RSI)
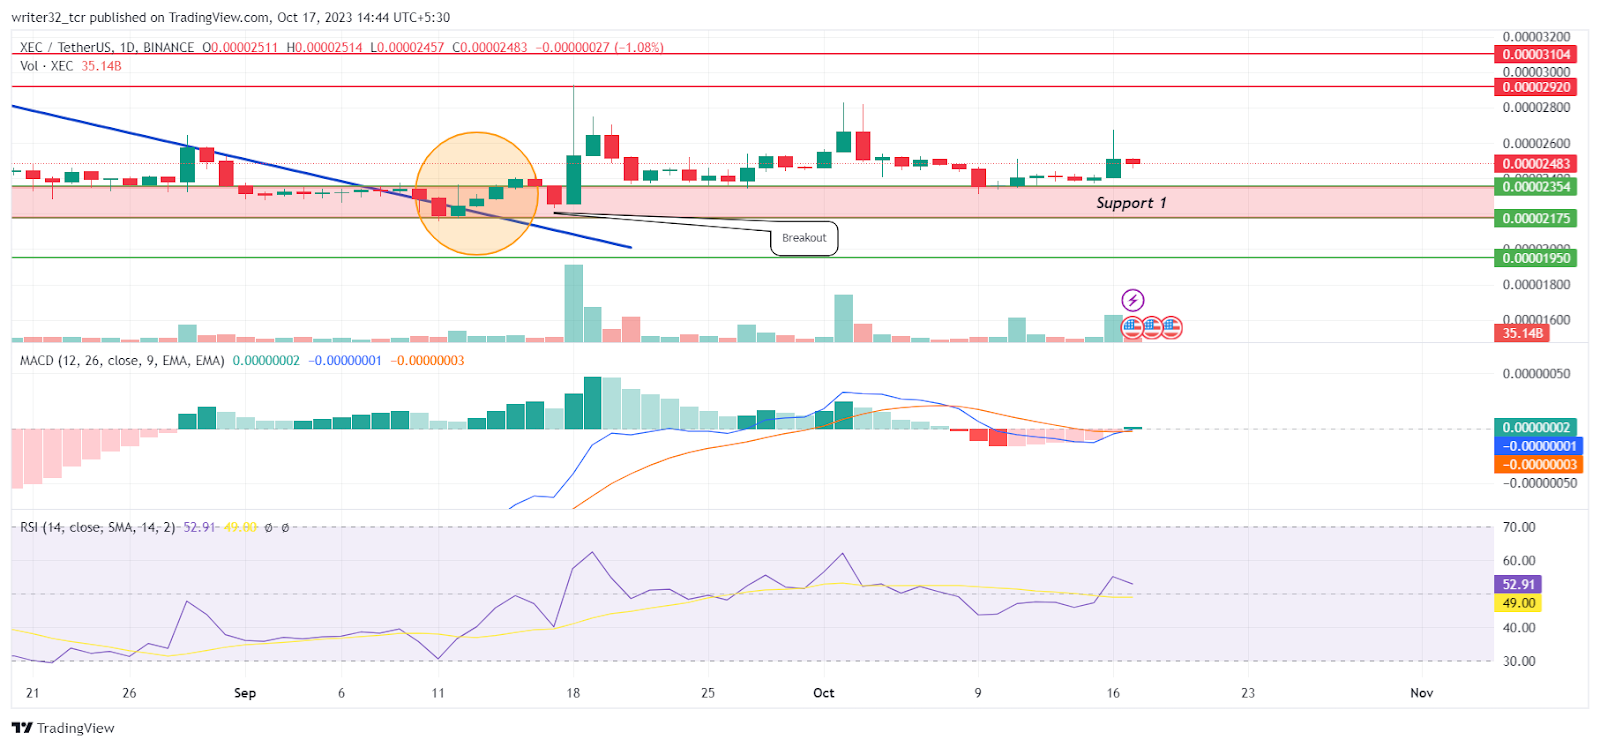
The RSI line is presently moving at 52.91 points and the SMA 14 is moving at 49.00 points. The RSI is just above the neutral level of 50 and this indicates that it is in the neutral zone.
Moving Average Convergence/Divergence (MACD)
The fast blue line moving average will soon cross above the red slow line moving average. The histogram shows a slight increase in the volume, which is a positive sign for the price movement.
XEC LIVE CHART
Conclusion
The analysis of the XEC coin price shows that it is trying to sustain above the 50-day EMA for an upward move. If that happens, the token’s price can make a bullish move. Otherwise, it may fall down again to the support levels.
Technical Levels
- Support Level: $0.0000217 to $0.0000235 and $0.0000195
- Resistance Level: $0.0000292 and $0.0000310
Disclaimer:
The views and opinions stated by the author, or any people named in this article, are for informational purposes only and do not establish financial, investment, or other advice. Investing in or trading crypto assets comes with a risk of financial loss.


