

- The ETC price also surged by 5% during the fake pump on the Bitcoin ETF approval news.
- The token is trading at $15.2 with an intraday rise of 1%.
- The token is down by 91.38% from the all-time high.
The ETC token gave a breakout from the bearish downtrend at the end of September. The price started an upward movement and crossed above the 50-day EMA. It also got rejected from the $17 short-term resistance and again fell down to the support level of $14.8. It has also recorded a negative ROI of 25.04% in the last 6 months.
The ETC token marked an all-time high on 7th May 2021, when it was priced at $176.16. The market cap of the token during the all-time high was at $15.55 Billion. ETC is trading with an upsurge of 79% in the trading volume in the last 24 hours.


The token has a current market cap of $2.18 Billion. The circulating supply of the token is 143.54 Million ETC, which makes up 68.13% of the total supply. The 24-hour trading volume is $114.01 Million.
Sentiment Analysis
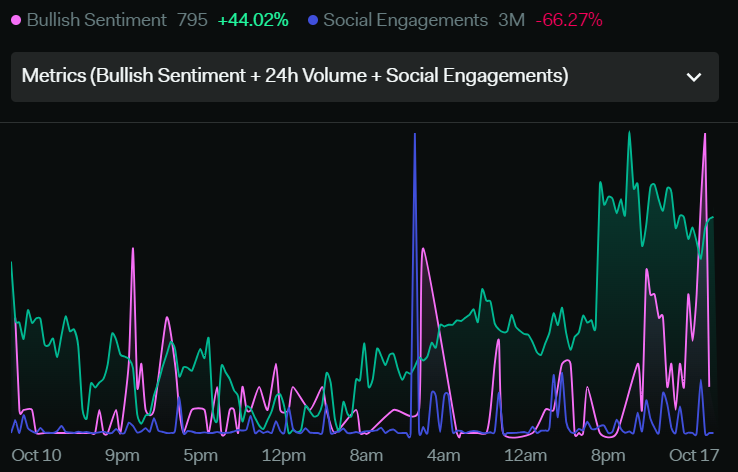
The total market volume of the token has dropped by 30.3% in a week. Total social engagements have reduced by 66.27% and the total bullish sentiments have increased by 44.02%. The overall analysis indicates a bearish move in the ETC coin price as social community engagement has dropped. Consequently, the volume of the token also declined. Bullish sentiments will be negligible until the volume starts rising.
Technical Analysis Of ETC (Daily-1D)
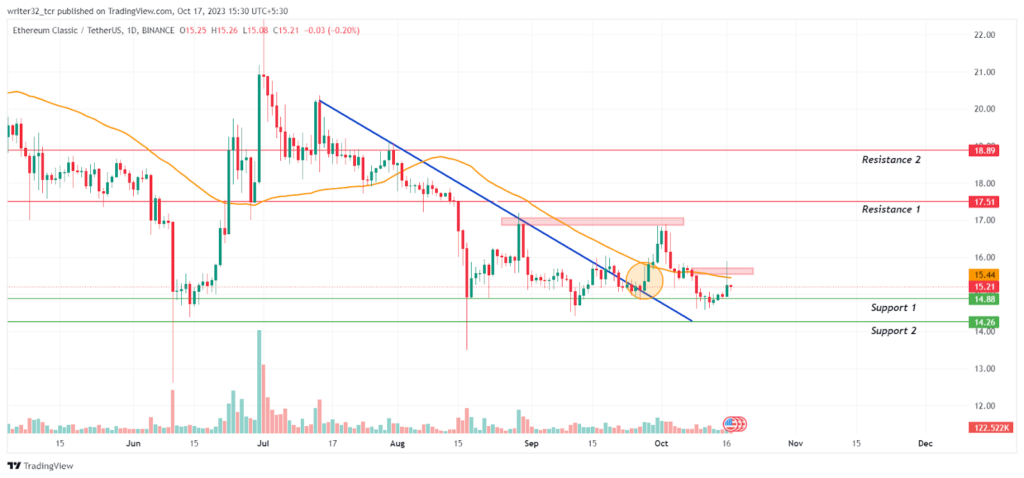
The chart shows that the ETC price was in a bearish downtrend, moving below a bearish trendline. It went down to the support level of $14.8. The price tried to break the downtrend twice but got rejected from the bearish trendline. In the third attempt, the price broke the downtrend and gave a breakout from the trendline.
The price also tried to make a bullish move after the breakout but got rejected from the $17 short-term resistance. Subsequently, It fell down again to the support level of $14.8.
On 16th October 2023, ETC was trading at the support level of $14.8. It gave a 5% pump there after the news of Bitcoin ETF approval. The price took support from the $14.8 level. It tried to move above with the hype but soon after the announcement was made that the news was fake, the price started coming down and closed at $15.2.
ETC is currently trading below the 50-day EMA. If the price crosses above the last lower low level of $15.5, it can reach $17 and move higher to $17.5 if it breaks above the short-term resistance of $17. The price can also reach $18 to $19 if the volume rises and the price breaks the resistance of $17.5.
However, If the price gets rejected from the last lower low level of $15.5, it will again fall to the support levels between $14.2 to $14.8.
What Indicators Say About ETC Price
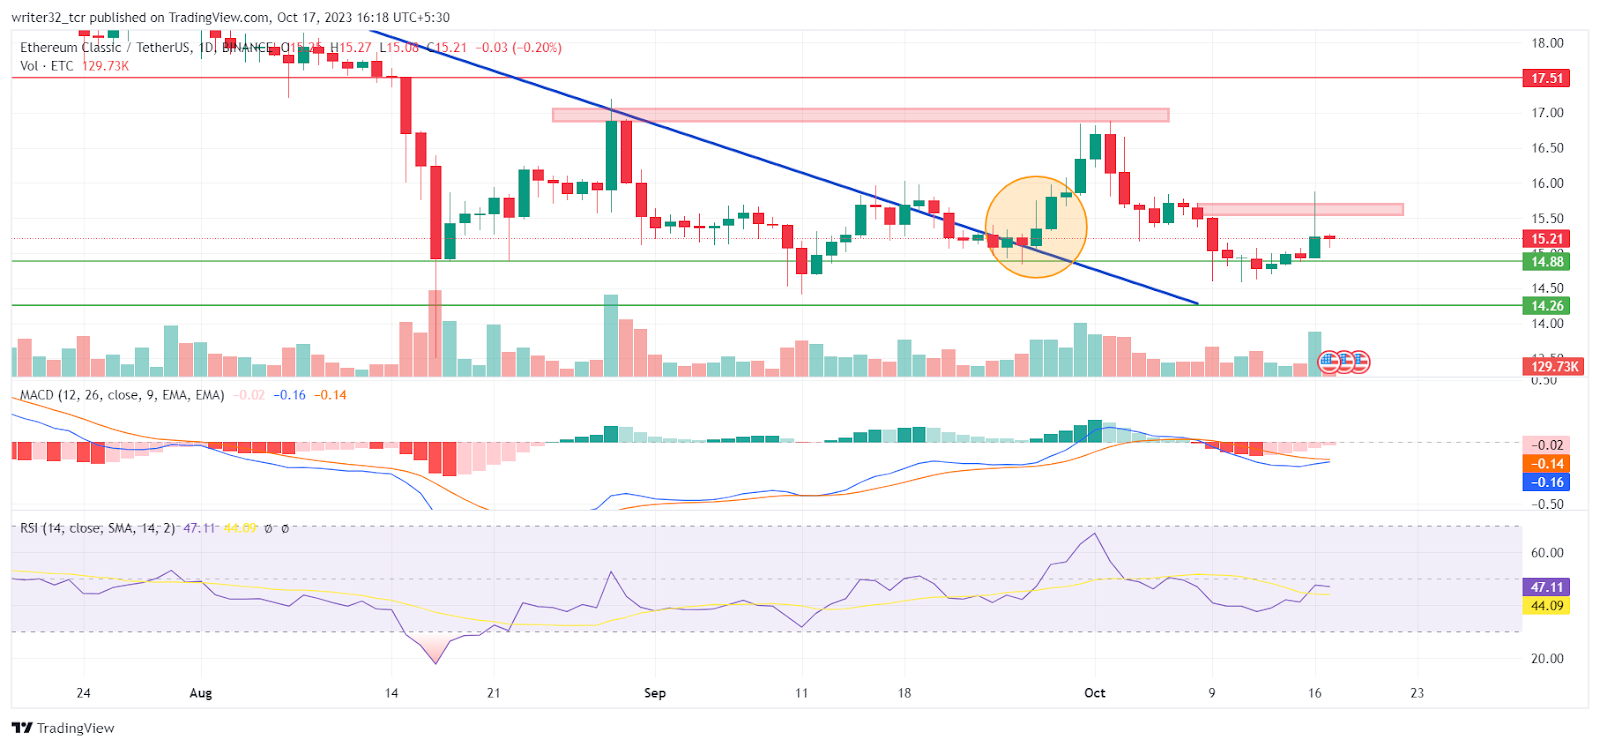
Relative Strength Index (RSI)
The RSI line is presently moving at 47.11 points and the SMA 14 is moving at 44.09 points. Both are below the neutral level of 50. The RSI shows medium-neutral movement in the price.
Moving Average Convergence/Divergence (MACD)
The fast blue line moving average will soon cross above the red slow line moving average. The histogram shows low volumes. Daily volume is increasing and soon, the volumes in the histogram will also increase.
ETC LIVE CHART
Conclusion
The overall analysis of ETC indicates a short upward move as the volume is increasing. However, the volume has to increase significantly so that the price can cross above the last lower low. Once the price gets above the $15.5 level and sustains there, it can move further upwards.
Technical Levels
- Support Level: $14.2 to $14.8
- Resistance Level: $17, $17.5 and $18.8
Disclaimer:
The views and opinions stated by the author, or any people named in this article, are for informational purposes only and do not establish financial, investment, or other advice. Investing in or trading crypto assets comes with a risk of financial loss.


