

- The OKB coin price has given a breakout from the bearish downtrend.
- It is trading at $43.87 with an intraday hike of 1.49%.
- The token is just down by 24.9% from the all-time high.
The token price gave a breakout from the downtrend trendline recently. It also crossed above the 50-day EMA.This move shows that price can be bullish and reach $47 soon. It has recorded losses of 20.07% in the last 6 months.
The token recorded its all-time high on 18th Feb 2023, where the token was priced at $58.46.


It is currently trading with an upsurge of 120% in trading volume in the last 24 hours.
The present market capitalization of $2.63 Billion. It has a current circulating supply of 60 Million OKB, which is just 20% of the total supply. The 24-hour trading volume of the token is $3.21 Million.
Sentiment Analysis
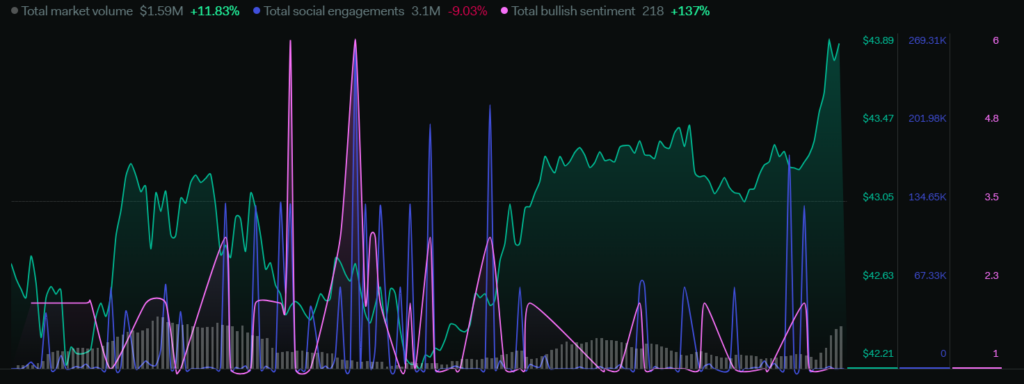
The total market volume has increased by 11.83% in a week. Total social engagements have dropped by 0.03% and the total bullish sentiments have surged by 137%. Overall sentiments are indicating a bullish trend as the volume has started to increase. The bullish sentiments have also surged after the price broke the downtrend.
Technical Analysis Of OKB ( Daily-1D )
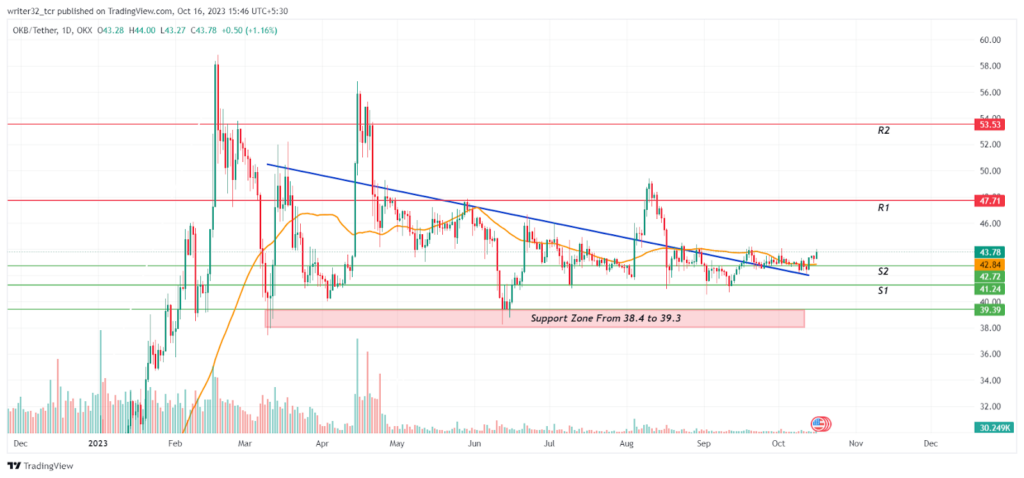
The price made its all-time high in the month of Feb and then price got bearish. After the price came down from the 50-day EMA, the price started to move under a bearish downtrend below the trendline. Once the price also tried to give a breakout from the trendline but it was a fake one. So, the OKB coin price came down and took support from the level of $41.
After taking support from the $41, the price got bullish and broke the trendline and crossed above the 50-day EMA. The volume is getting increased after the price got above the EMA, which is a bullish sign. If the market goes well and the volume kept on rising, token’s price can reach $47. Suppose the price breaks the resistance of $47, the next target can be $53 and further to the all-time high range.
The OKB coin price can again fall to the 50-day EMA if it gets rejected from the $47 range. If price breaks below the 50-day EMA, it can fall to the $41 support level.
Indicators On The Price Of OKB
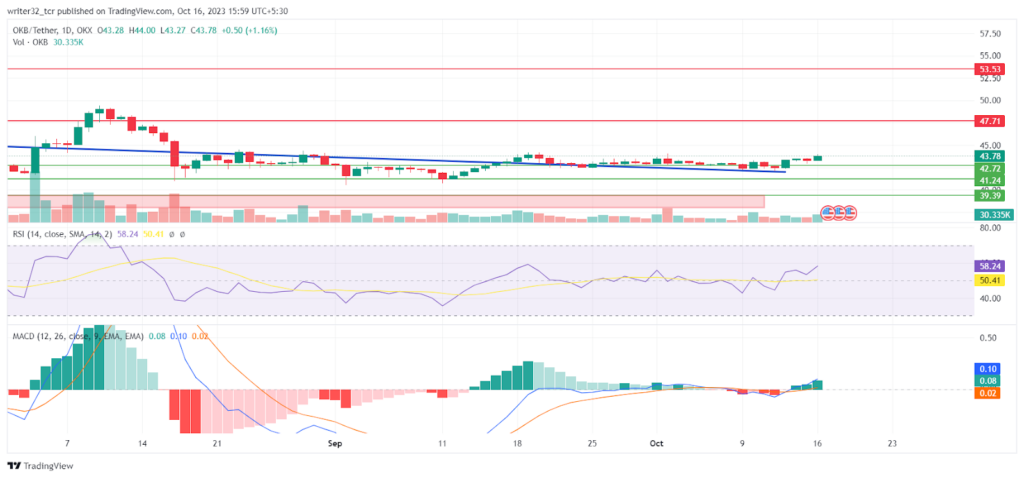
Relative Strength Index (RSI)
The RSI line is presently moving at 58.24 points and the SMA 14 is moving at 50.41 points. Both are above the neutral level of 50. The RSI shows an ongoing buying activity in the market and the movement of price upwards. The RSI looks in favor of a bullish move.
Moving Average Convergence/Divergence (MACD)
The fast blue line moving average is moving above the red slow line moving average. The histogram shows a significant rise in the volume which is a positive sign for an upward movement.
OKB LIVE CHART
Conclusion
The overall analysis of the OKB coin price indicates a bullish move in the price as all the aspects are in respect for an upward movement in the price. However, If the price falls and if this breakout is fake, the token price can be bearish again.
Technical Levels
Support Level: $41 and $42
Resistance Level: $47.7 and 53.5
Disclaimer:
The views and opinions stated by the author, or any people named in this article, are for informational purposes only and do not establish financial, investment, or other advice. Investing in or trading crypto assets comes with a risk of financial loss.


