

- The APENFT price is currently trading at $0.0000003261.
- The coin price has been consistently rising since the last seven intraday sessions.
APENFT platform was launched to create vast opportunities and address the limitations of the NFT marketplace. This project aims to bridge the gap between artists and blockchain technology.
APENFT Price Analysis
The APENFT token’s price is currently trading at $0.0000003261 with a decline of 0.06% and is trading with a 24-hour volume of $350.524 Billion. It has a market capitalization of 325,537,379 USD with a circulation supply of 990,105,682,877,398 NFT coins. In addition, it has a max supply of 999,990,000,000,000 NFT coins.


1-Day Chart Price Analysis of APENFT
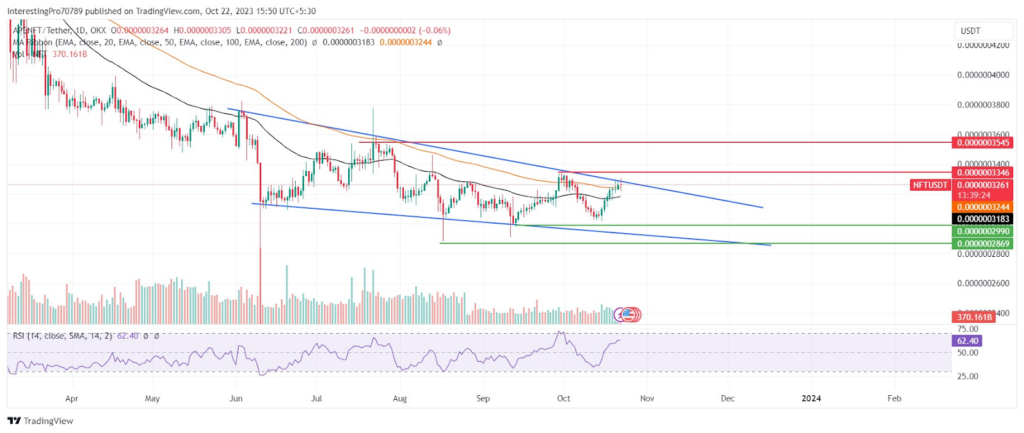
For the last 7 days, the price was forming a bullish candle and gained 6.50%. In the wider outlook of the chart, it seems it is trading in a falling wedge pattern. Currently, it is facing rejection from the upper trendline of the falling wedge pattern.
The APENFT price is currently trading above the 50-day and 200-day EMAs, showing the buyers are the ones who have control of the price. Currently, the price is sustaining above the 100-day EMA.
The relative strength index is at 62.23, which is a bullish territory. The RSI line is sloping in the upward direction, showing that the buying pressure is being applied by the buyers to make the price rise.
In the current scenario, the price is facing rejection from the upper trendline of the falling wedge pattern. If the next few candles close below the recent green candle low, it may fall to its support at $0.0000002990. However, for the continuation of the downtrend, it should also give the breakdown of the $0.0000002990. After that, it may continue its fall to its next support at $0.0000002896.
However, for bulls to continue their dominance they must give the breakout of the falling wedge pattern and the immediate resistance of $0.0000003346. It can make the price to rise to its next resistance at $0.0000003545.
Conclusion
In the current scenario, the price is in a bullish trend after reclaiming the 50-day and 100-day EMA levels. If the NFT token price gives the breakout of the falling wedge pattern and $0.0000003545 resistance, it may continue its uptrend. Suppose the price faces rejection from the upper trendline of the falling wedge pattern and closes below the recent green candle low, it may start its downtrend.
Technical levels
- Resistance Levels: $0.0000003346 and $0.0000003545.
- Support Levels: $0.0000002990 and $0.0000002896.
Disclaimer
The views and opinions stated by the author or any other person name in this article are for informational purposes only. They do not provide financial, investment, or other advice. Investing or trading in crypto comes with a risk of financial loss.


