

- The LRC coin is trading at $0.170 with an intraday upsurge of 0.32%.
- The price is presently under a bearish trend.
- It is trading at the support zone, below the 50-day EMA.
The LRC coin price has recorded a negative ROI of 49.52% in the last 6 months. It marked its yearly high of $0.494 in the middle of February. The price has been experiencing a bearish trend for a long time. It is moving below a bearish trendline, where the price is getting rejected from the trendline and continuing the downtrend. It is also trying to give a breakout from the bearish trend and cross above the 50-day EMA.
Buyers of the market are trying to push the price up but the bearish investors are throwing the price down every time as a rejection from the trendline.


The token marked an all-time high of $3.83 on 10th November 2021. It is almost 95% down from its all-time high, bringing it to a price of $0.170. The market cap of the token during the high was at $4.25 Billion.
The trading volume of the token has marked a rise of 45% in the last 24 hours. The circulating supply of the token is currently 1.33 Billion, which is 96.88% of the total supply. It has a current market cap of $227.61 Million.
Sentiment Analysis
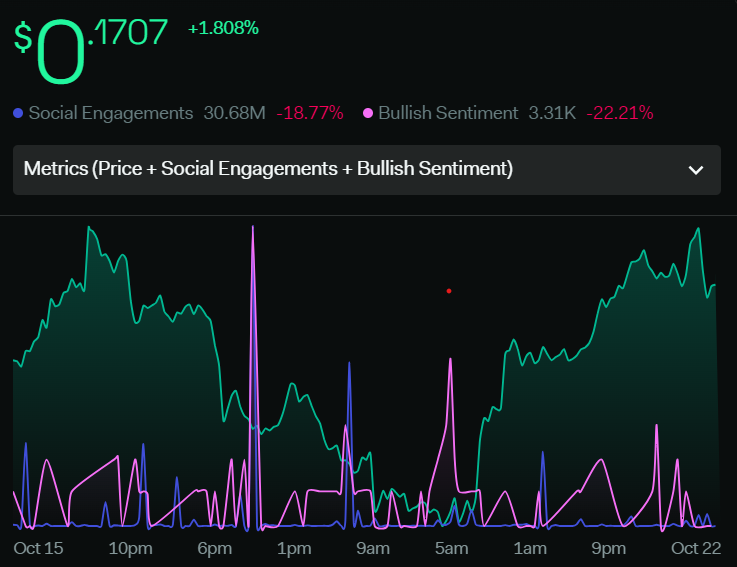
The total volume of the token has increased 7.6% in a week. The social engagement metric has decreased by 18.77%, which represents the reduced activity of the social community. It resulted in a low volume hike which is not sufficient to break the trendline. Consequently, bullish sentiments fell by 22.21%. Overall sentiments indicate a bearish trend of the price until it breaks the trendline.
Technical Analysis Of LRC Token (Daily-1D)
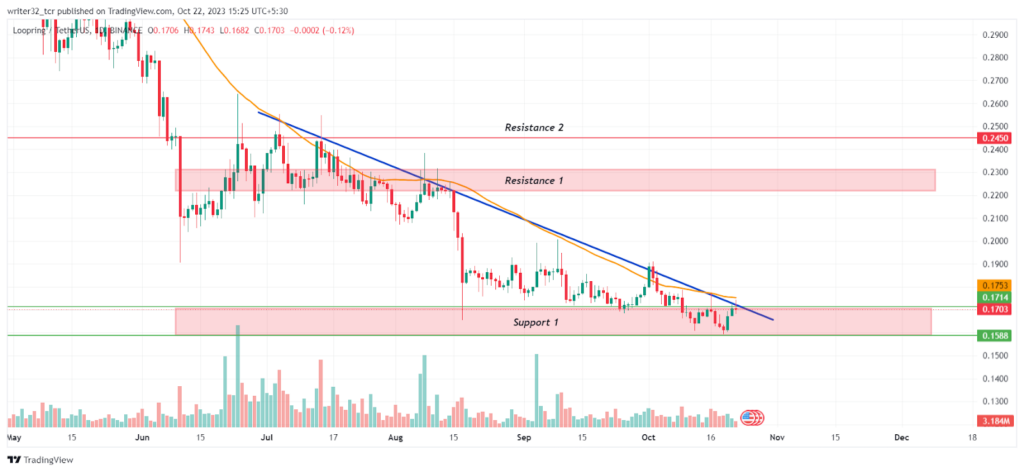
The price is presently trading at the support level, where it is trying to break above the trendline and start a bullish uptrend. After the successful breakout from the trendline, the price can reach $0.222 to $0.233 and give an upward move of almost 30%. For this move, the price has to cross above the 50-day EMA, sustain there, and move upside with a sizable volume. Bulls have to diminish the bearish investors, who will try to push the price down.
However, If the price gets rejected from the trendline again, it may lose the support level of $0.159 to $0.170 and continue its bearish trend. In an opposite scenario, the price after rejection can take support from $0.159 and then try to break the trendline.
Indicators on the Price of LRC Token
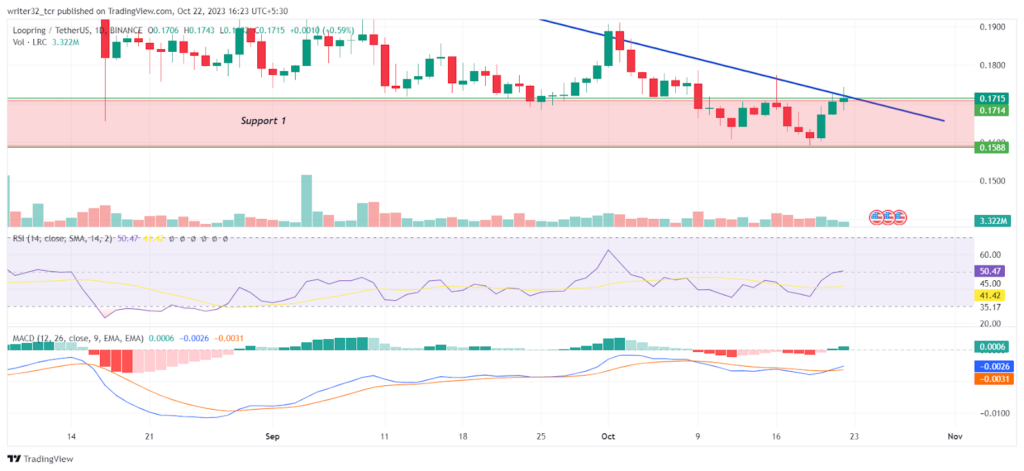
Relative Strength Index (RSI)
The RSI line is moving at 50.47 points and the SMA 14 at 41.42 points. RSI is above the neutral level. The RSI also crossed above from the SMA 14 giving an upside move to the price.
Moving Average Convergence/Divergence (MACD)
The fast blue line moving average gave a bullish cross above the red slow line moving average. The histogram has started to become green, which is a sign of a bullish movement in the price.
LRC LIVE CHART
Conclusion
The market structure and the price action of the LRC token suggest that the price is presently in a bearish trend. It can only be bullish when it breaks the bearish trendline and moves above the 50-day EMA.
Technical Levels
- Support Level: $0.159 to $0.170
- Resistance Level: $0.222 to $0.231 and $0.245
Disclaimer:
The views and opinions stated by the author, or any people named in this article, are for informational purposes only and do not establish financial, investment, or other advice. Investing in or trading crypto assets comes with a risk of financial loss.


