

- The ROSE Coin has been trading sideways since the middle of August 2023.
- This crypto asset has faced resistance from the downward-sloping trendline.
- Oasis Network’s native token has declined by over 26% in a year.
Oasis Network was developed by Dawn Song, with the motive of providing Data privacy to users. It is a scalable decentralized blockchain built for decentralized finance (DeFi). It has a high level of scalability, which is provided along with the low Gas fees. This platform also offers a smart privacy feature that is supposed to work with DeFi and other Encrypted Data.
Oasis Network coin price has been like a roller coaster ride for the investors as it has swung both ways. In the initial phase of trading the coin price has surged a lot with a rise of over 1660% from the bottom. After January 2022, the stock has declined massively and eroded more than 92% of the gains.


Oasis network has started 2023 with a boom, as the coin price has surged by over 153% within 2 months of trading. However, after February it halted the uptrend and started declining. It has fallen since then and the coin price has been trading in a narrow range since August 2023.
What the ROSE Coin Chart is indicating About the Price Action?
The ROSE coin has formed a downward sloping trendline on the trendline, which shows that the price is currently in a bearish grip. It has been trading flat since August 2022 between the range of $0.04416 and $0.03705. However, the coin price is currently very close to the trendline resistance. It has been forming green candles that are looking bullish, which is a good sign for investors holding the ROSE coin.
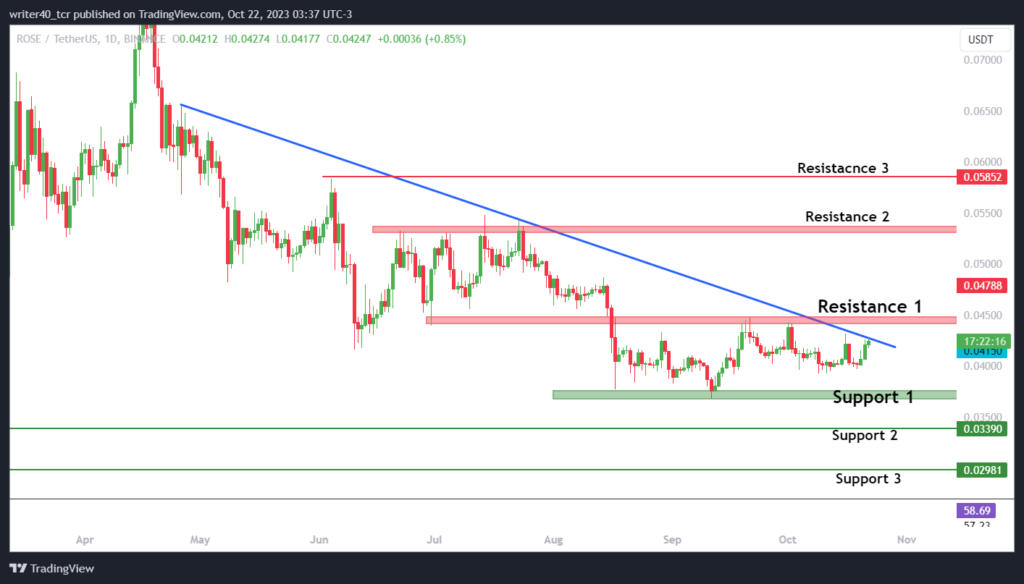
The trendline resistance is present at the level of $0.04263, which can act as a resistance for the ROSE Coin price. Apart from this, $0.04416, 0.05289 and $0.05852 levels can act as a resistance for the price. Considering the support level, it is present at the level of $0.03705, $0.03390, and $0.0298.
What Exponential Moving Average and Relative Strength Index is indicating?
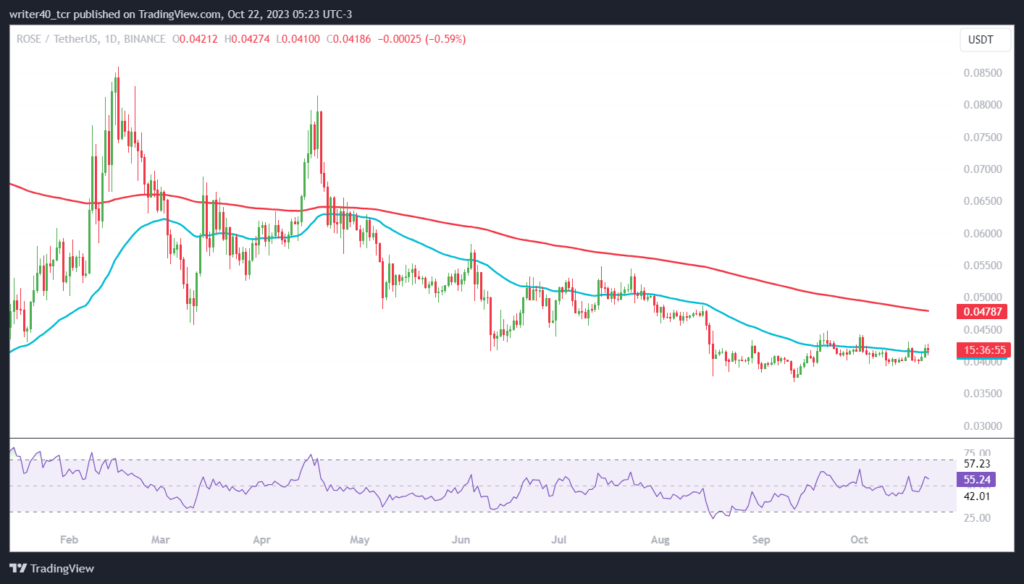
If we observe the 50-day and 200-day Exponential Moving Averages, they are currently placed above the price. It indicates that the price is underperforming as per the past performance. However, the price is struggling to regain control over the 50-day Exponential moving average. The relative strength Index has risen slightly over time and it is showing that the buyers are gaining momentum on the price.
Conclusion
The ROSE Coin price is currently trading sideways and both the buyers and sellers are trying to conquer the resistance and support levels. The Bulls should raise the price above the resistance level of $0.04416 to take control of it. However, if the coin price gives a breakdown below the support level of $0.03705, the sellers will get more aggressive on the coin price.
Technical Level
- Resistance – $0.04416 and $0.05289
- Support – $0.03705 and $0.03390
Disclaimer
The views and opinions stated by the author, or any people named in this article, are for informational purposes only. They do not establish financial, investment, or other advice. Investing in or trading crypto assets comes with a risk of financial loss.


