

- XEM is trading at $0.0271 observing a decrease of 1.64% in the intraday session.
- The price is currently trading above the 50-day EMA.
- It is presently in the consolidation zone.
XEM price is trying to make an upward movement following a trendline in the daily time frame. The confirmation of support from the trendline will validate a bullish move in the price. It has recorded a negative ROI of 26.23% in the last 6 months. The price marked its yearly high of $0.0772 at the end of February. Since then, the value of the token has declined by almost 65%.
The token is currently down by 98.7% from the all-time high. It marked an all-time high of $2.09 on January 4, 2018. During this high, the market capitalization of the token was at 15.20 Billion.


The circulating supply of the token is 8.99 Billion XEM coins right now. It has a market cap of $243.37 Million. The daily trading volume of the token has dropped by 45% in the last 24 hours.
Sentiment Analysis
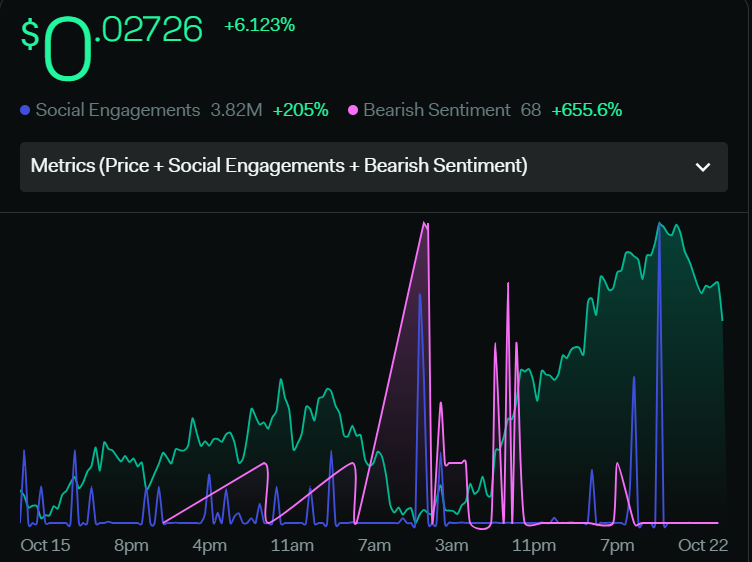
The volume of the token has increased by 53.9% within a week. Social engagements have surged by 205%, which shows activeness among the social community. Bearish sentiments are rising as the price is facing a rejection from the resistance zone. The volume has started to decrease as people have started to take short trades from the resistance level. As a result, bearish sentiments have hiked by 655%.
Technical Analysis Of the XEM Token (Daily-1D)
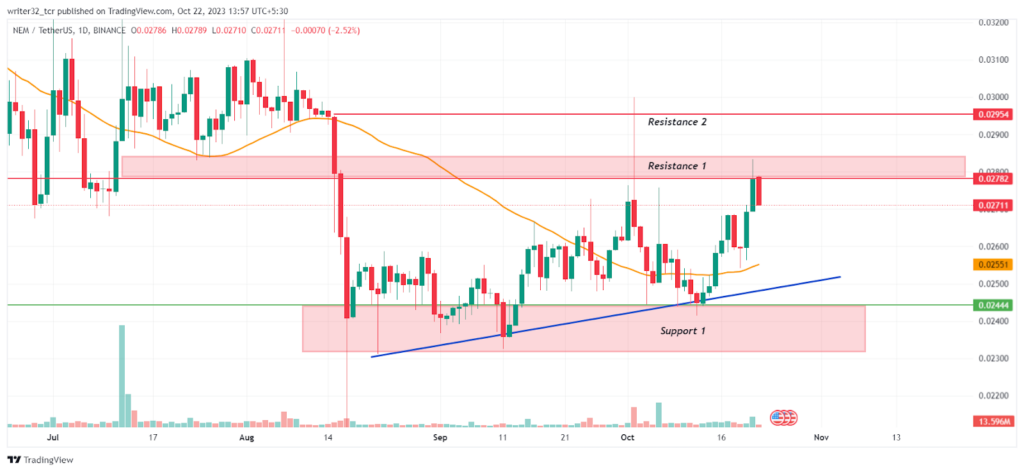
In the last bearish move, the XEM price started the downfall from the level of $0.0295 level and fell down to the support level of $0.0231 to $0.0244. The bearish investors pushed the price down to $0.0200, but the bulls dominated them and took the price up to the support level.
The price took support from the level of $0.0231 to $0.0244 and started a consolidation move. XEM coin’s price also started to move on a trendline. However, the confirmation of the trendline will be when the price confirms its support one more time from the trendline.
Suppose the price falls below the trendline and the 50-day EMA, it can retest the support level of $0.0231 to $0.0244.
Indicators On The Price Of XEM Token
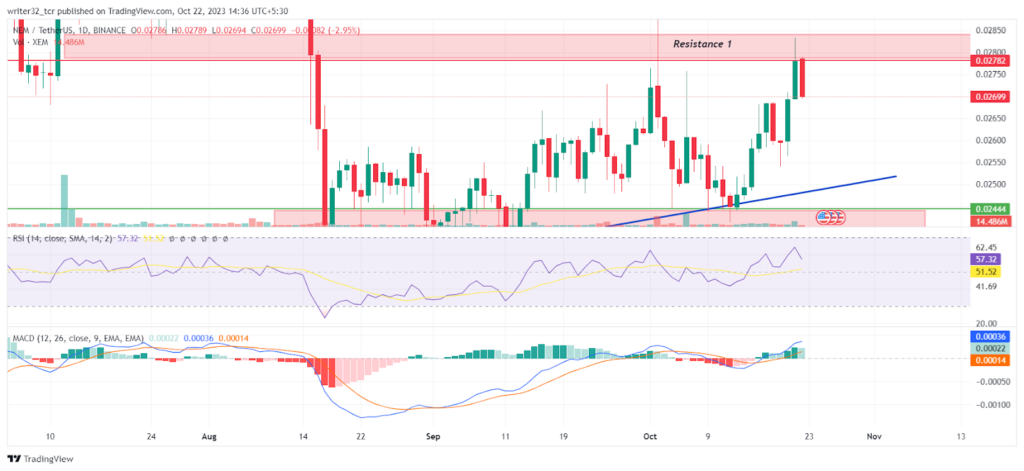
Relative Strength Index (RSI)
The RSI line is moving at 57.32 points and the SMA 14 at 51.52 points and both are above the neutral level. The RSI is indicating a slight upward trend in the price.
Moving Average Convergence/Divergence (MACD)
The fast blue line moving average is in motion above the red slow line moving average The histogram shows increases in the volumes which indicates an uptrend in the price of the token.
XEM LIVE CHART
Conclusion
The overall analysis of the XEM price suggests a bearish move until the price reaches the support level on the trendline. If the price breaks from below the trendline, it can fall to the support level.
Technical Levels
- Support Level: $0.0231 to $0.0244
- Resistance Level: $0.0278 to $0.0284 and 0.0295
Disclaimer:
The views and opinions stated by the author, or any people named in this article, are for informational purposes only and do not establish financial, investment, or other advice. Investing in or trading crypto assets comes with a risk of financial loss.


