

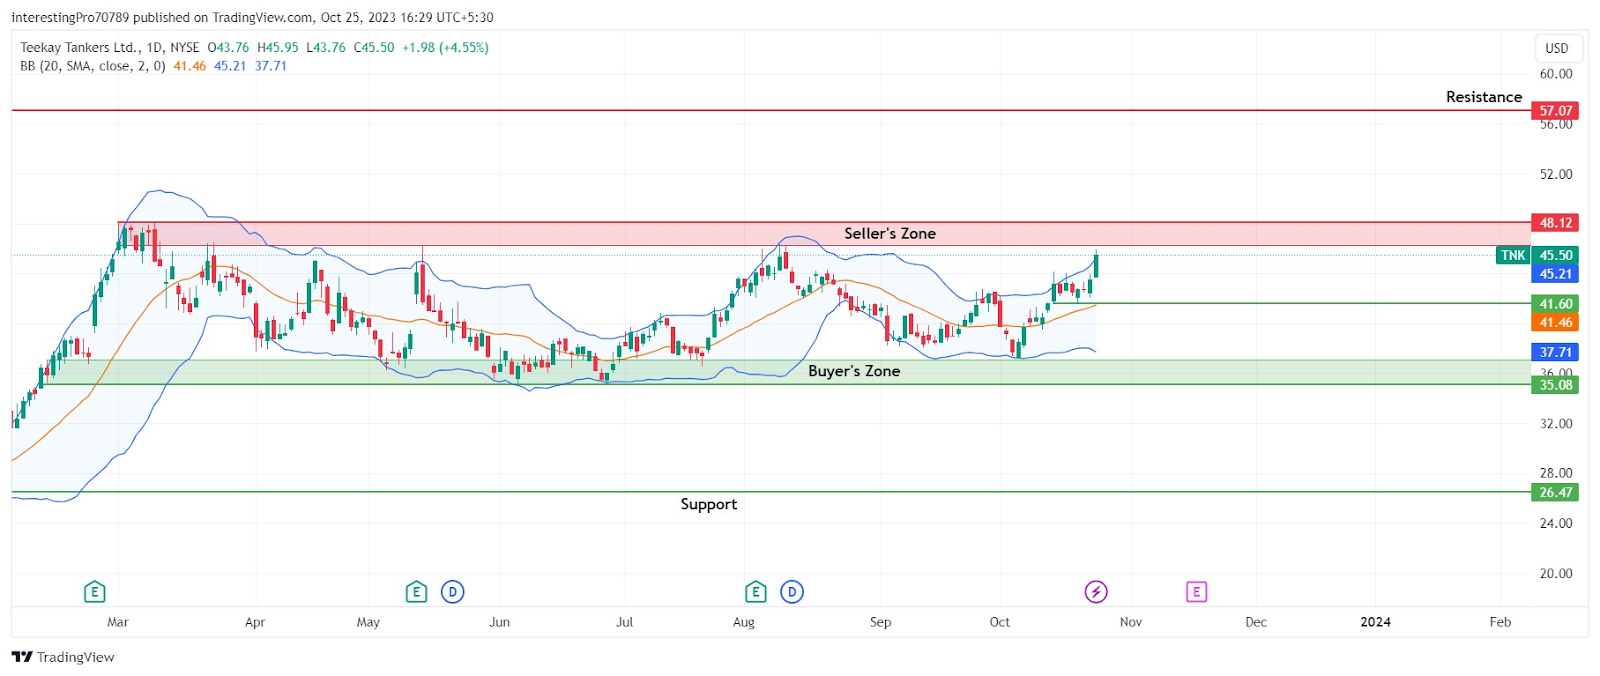
- The TNK stock price is currently at $45.50.
- The price is in its consolidation phase with the current dominance of buyers.
Teekay Tankers Limited (NYSE: TNK) is a marine energy transportation company. It provides transportation services for crude oil and refined petroleum products to its customers. The firm runs its operation through tankers and ship-to-ship transfer segments.
Teekay Tankers Ltd (TNK) Stock Analysis
The TNK stock price closed at $45.50 in its last trading session and gained 4.55%. The company’s 10-day average trading volume is recorded at 386.897K and it has a market capitalization of $1.55 Billion.


The TNK stock price is currently consolidating in a wide range between the $48.12 resistance zone and the $35.08 support zone. However, the price has recently commenced a bullish rally from the $35.08 support zone. It has increased by 22.61% in the last 14 trading sessions.
Technical Indicators on the Current Trend
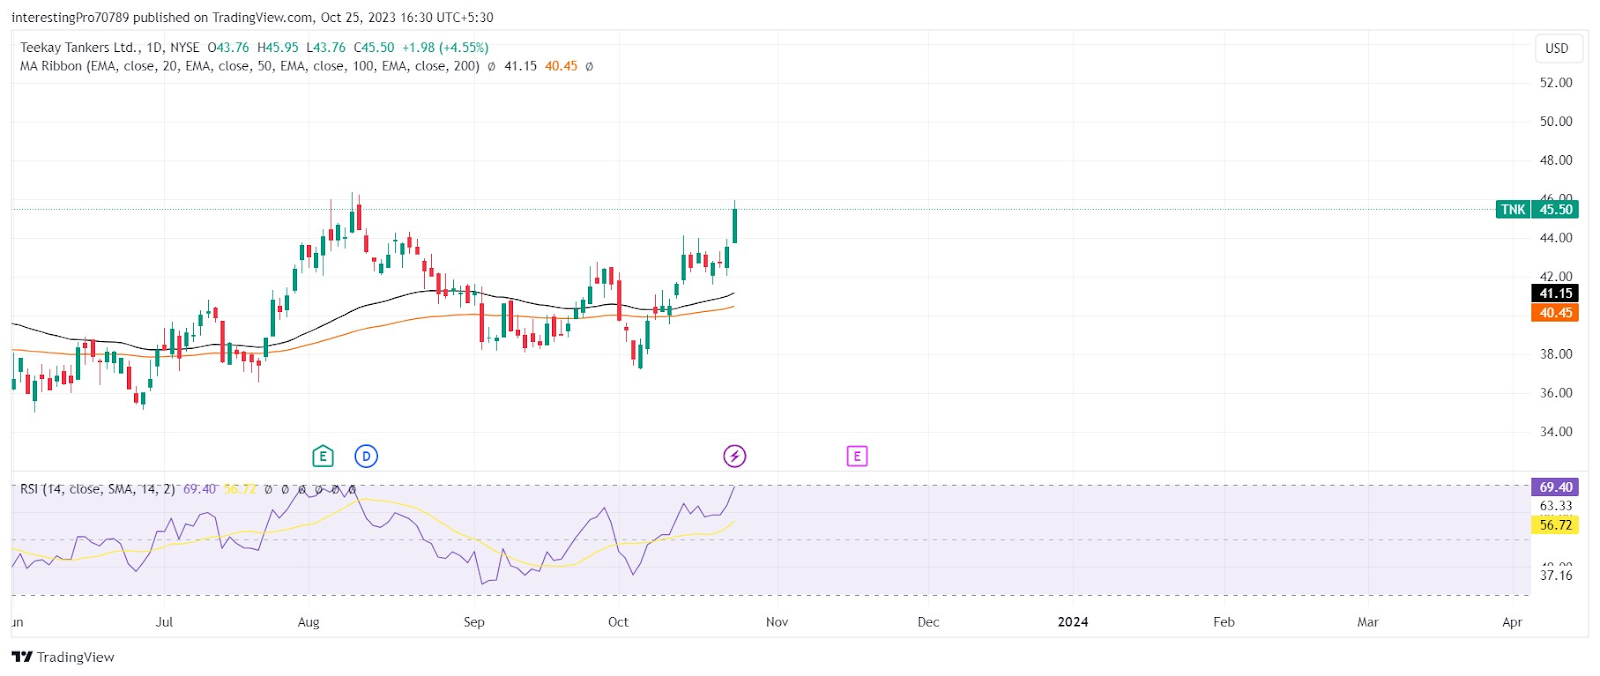
The price has recently claimed the 50-day and 100-day EMAs, and is above them which shows the overall dominance of the bulls. However, the EMAs are sideways which shows the indecisive nature of the price.
The relative strength index is at 69.40, which is marked as bullish territory. The RSI line is sloping in the upward direction, showing the ongoing buying pressure from the bulls’ side. However, it is heading toward the overbought territory from where the price always makes a pullback.
The Bollinger band line is showing an increase in volatility. The price has just closed above the upper band which indicates that the price has a chance of falling in the upcoming trading session.
Will Sellers Put a Stop to the Ongoing Bullish Rally?
In the current scenario, the buyers have taken control of the price and have reclaimed the 50-day and 200-day EMAs. However, the Bollinger bands and the RSI are pointing toward a fall in the price. So the price might face difficulties to close above the $48.12 resistance zone and can fall from there to its support at the EMAs and the $41.60 support level.
However, as long as the price is sustained above the EMAs and the $41.60 level, the buyers will have control of the price. This can lead to the retesting of the $48.12 sellers’ zone (resistance) again and again. For the continuation of the upward move, the price must have closed above the $48.12 resistance level. After this, it may rise to its next resistance at $57.07.
If, by chance, the price gives the breakdown of the three current acting supports, it may fall to its buyers’ zone at the $35.08 level. For the full dominance of the sellers, the price must give the breakdown of the $35.08 buyers’ zone (support), and then the price may be seen falling to its next support at $26.47.
Conclusion
The overall trend of TNK stock is indecisive as the price is consolidating in a wide range between $48.12 and $35.08. The Bollinger bands and RSI are pointing towards a fall in the price that can happen in the upcoming trading sessions. Traders should wait for the breakout or breakdown of the range for confirmation on the direction of the price movement.
Technical levels
Resistance Levels: $48.12 and $57.07.
Support Levels: $41.60, $35.08 and $26.47.
Disclaimer
The views and opinions stated by the author or any other person named in this article are for informational purposes only. They do not provide financial, investment, or other advice. Investing or trading in crypto comes with a risk of financial loss.


