

- Intel Corporation (INTC) company pays a dividend of -244%.
- Intel Corporation has lost a huge amount of annual profit margin percentage.
- INTC stock has a debt of $42 Billion and a free cash flow of negative $9 Billion.
The Intel Corporation stock is currently following a downward trajectory, marked by a consistent pattern of lower lows in the weekly time frame. Additionally, the price has recently broken down from a channel pattern, indicating a weakening trend.
The dividend payout ratio for Intel Corp. is negative 244%, which is an unusual figure. A negative dividend payout ratio suggests that the company may not be paying dividends or could be operating at a loss. It’s important to note that such a ratio typically indicates irregular or adverse financial circumstances. Following its peak at $68 on April 21, 2021, the Intel stock price declined by approximately 64%. However, it found support at $2.43, resulting in a notable 63.3% rebound. Despite this, the recent price movement shows a breakout from a rising channel pattern, indicating a lack of strength in the stock.


The price chart displays a weak structure, implying the potential for further price declines. The overall pattern signifies a prevailing downtrend momentum.
The annual profit margin percentage of the company has also declined. The profit margin for the year 2020 was 26.8% and it came down to 12% by the end of 2022. This represents the weak financial condition of the company.
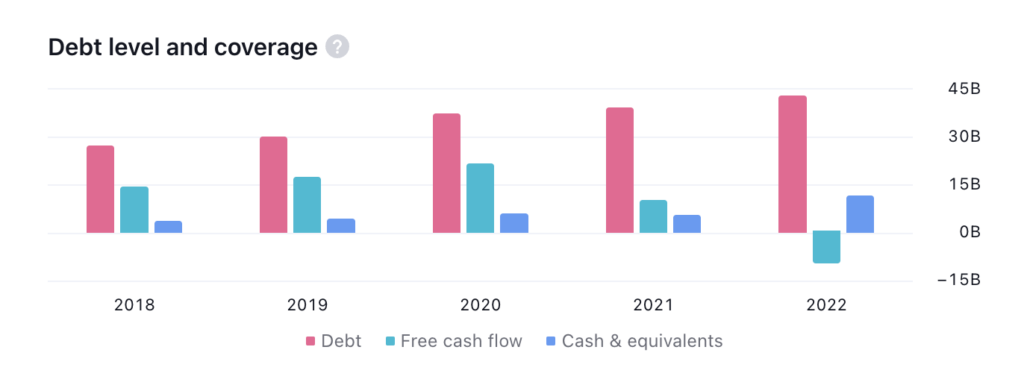
The price of the stock has given a return of -3% in the last three and the company has a debt of $42 Billion and the free cash flow is in a negative figure. Thus, it represents that the company does not have enough cash to repay its debt.
Intel Corporation (INTC) Stock Price Analysis
According to the MACD indicator, it is noticeable that the MACD line remains positioned under the signal line. In tandem with this, a red histogram is emerging in the INTC stock, which collectively suggests a bearish trend. This alignment signifies the potential for a price decline as both lines reside in the negative region.
Furthermore, the 14-day SMA and RSI lines of Intel Corporation stock have dipped below the 50 level. This shift is typically considered unfavorable and serves as an additional indication of a potential downward movement in the future.
Conclusion
The INTC stock is currently showing a downtrend momentum. The price has recently given a breakout from the channel pattern. In the last three months, the company has given a negative return. The indicators are also negative for the stock and the profit margin is also decreasing. Hence, the price is likely to decline in the upcoming days.
Technical Levels
- Support Levels: $35 and $40
- Resistance Levels: $35 and $38
Disclaimer
The views and opinions of the author or anyone in this article are for informational purposes only. They do not offer financial, investment, or other advice. Investing or trading crypto assets involves the risk of financial loss.


