

- The HBAR coin is currently trading at $0.0519.
- The token price is trading in a symmetrical triangle pattern.
HBAR is a native token of the Hedera Network which is a proof-of-stake (PoS) network that is mainly used for the protection of the networks. It can be used to make payments for transaction fees, protect the network from attacks coming from PoS, pay for network service, and pay for decentralized app development.
Hedera Hashgraph (HBAR) Coin Analysis
HBAR coin price gained 0.1% in the last 24 hours. Currently, it is trading at $0.0514 with a trading volume of $18.675 Million. It is ranked number 30 by the coin market and it has a market capitalization of 1,727,121,791 USD. It is currently supplying around 33,530,602,249 HBAR coins in the market and it has a max supply of 50,000,000,000 HAR coins.


Price Analysis On Daily Timeframe
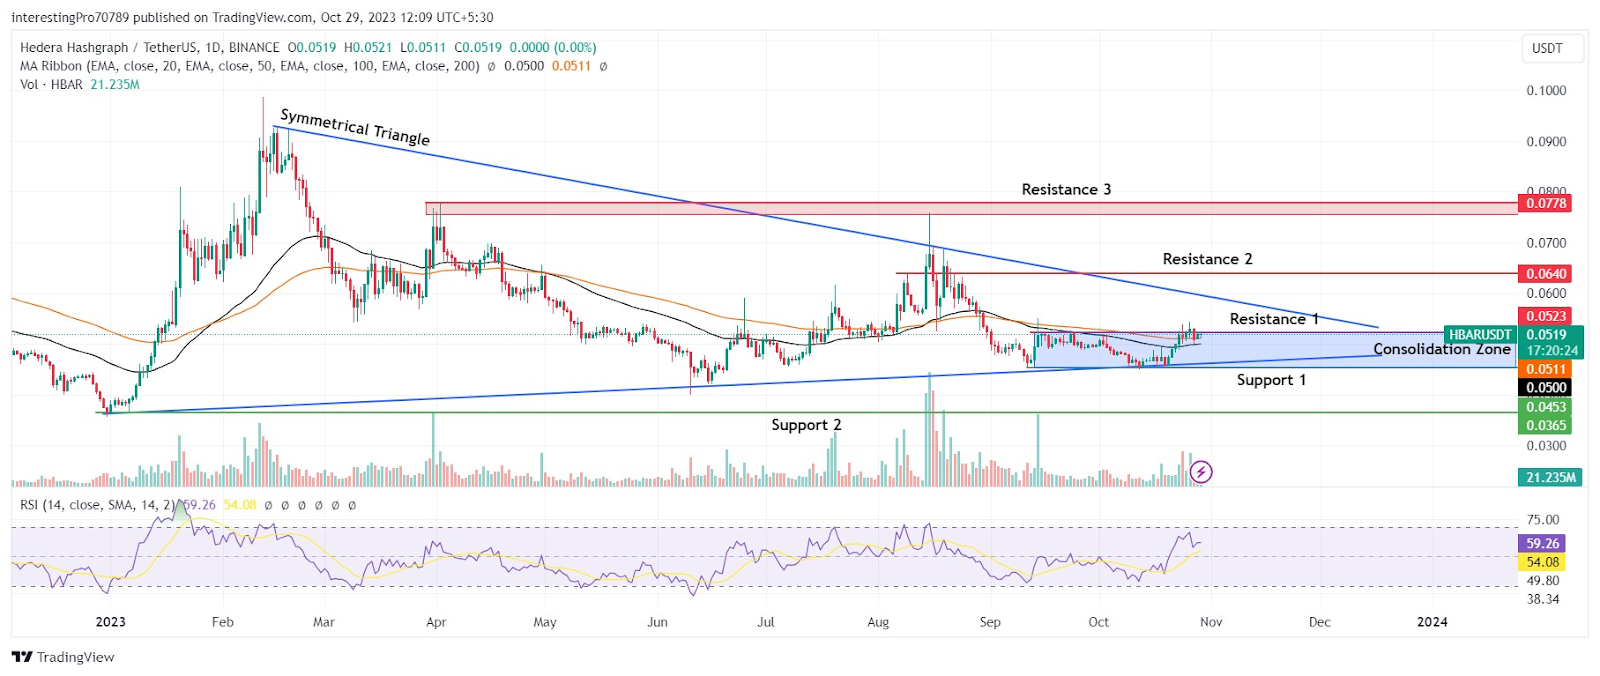
The wider outlook of the chart shows the coin HBAR coin price is currently trading inside a symmetrical triangle pattern. Currently, it is consolidating in the range of $0.0523 (resistance) and $0.0453 (support).
In the current situation, the price is initiating a bull run and is testing the $0.0523 resistance. The price has reclaimed the 50-day EMA and 100-day EMA and is currently sustaining above it which shows the bulls are trying to take full control of the price. The Relative Strength Index is at 58.34 which is a bullish territory. However, the RSI line is sloping in a downward direction, which indicates the ongoing selling pressure.
All in all, the bulls are trying their best to take control of the price. On the other hand, the bears are trying to stop them. So in the current scenario, as long the price is sustained above the EMA lines. Its chances are high to give the breakout of $0.0523 resistance and continue its ongoing bull run.
If it gives the breakout of the $0.0523 resistance then it will easily reach its resistance at $0.0640. For the further rise, it must give the breakout of this resistance also. After which it may rise to its next resistance at $0.0778.
The sellers also seem to trying their best to stop the price from its further rise at $0.0523 resistance. If they manage to close the price below the EMA lines again then the price might fall to its support at $0.0453. For the continuation of the downtrend, it must close the price below this support. After which the price can fall to its next support at $0.0365.
Conclusion
The HBAR overall sentiment is indecisive. However, the buyers are showing their strong presence by initiating a bull run from the $0.0453 support and reclaiming the 50-day and 100-day EMA lines. The sellers are constantly trying to stop them at $0.0523 resistance. The buyer has the upper hand in the current scenario and can change the current indecisive sentiment to bullish sentiment.
Technical levels
Resistance Levels: $0.0523, $0.0640 and $0.0778.
Support Levels: $0.0453 and $0.0365.
Disclaimer
The views and opinions stated by the author or any other person named in this article are for informational purposes only. They do not provide financial, investment, or other advice. Investing or trading in crypto comes with a risk of financial loss.


