

- The LTC token price has formed an inverted flag and oole pattern on the daily chart.
- The Litecoin token price has melted by over 27% in the last three months.
- The current market price of the Litecoin token is $67.90.
In the current trading session, the Litecoin token price is in positive territory. However, the token price shows little volatility in the current trading session. If we notice the price action of the token, it is up by only 0.28% even though the price has been rising since the trading started for the day.
The overall trend of the Litecoin token is strongly bearish, as the coin price has declined by over 83% from the highs. It reached a high of $413.49 on 10 May 2021 and since then, it has declined on every rise. This fall was halted in June 2022 and the price reversed the trend and since then, it has been slightly rising.


Considering the price action of the Litecoin token in 2023, it has been a roller coaster ride for the investors. At the beginning of the year, the coin price rose sharply but soon began consolidating within a range. It reached an annual high of $115 in July 2023 and since then, it started to decline. It is trading about 40% below the year-high level.
A Quick Overview of the Litecoin Token Chart
The LTC Token Price has formed an inverted flag and pole pattern. The upper level of the rising channel is present near the level of $73.50 and while the lower level is present at $60.22. These levels can act as support and resistance to the price in the future. The Litecoin token price has formed a strong bearish candle at the upper trendline of the rising channel pattern.
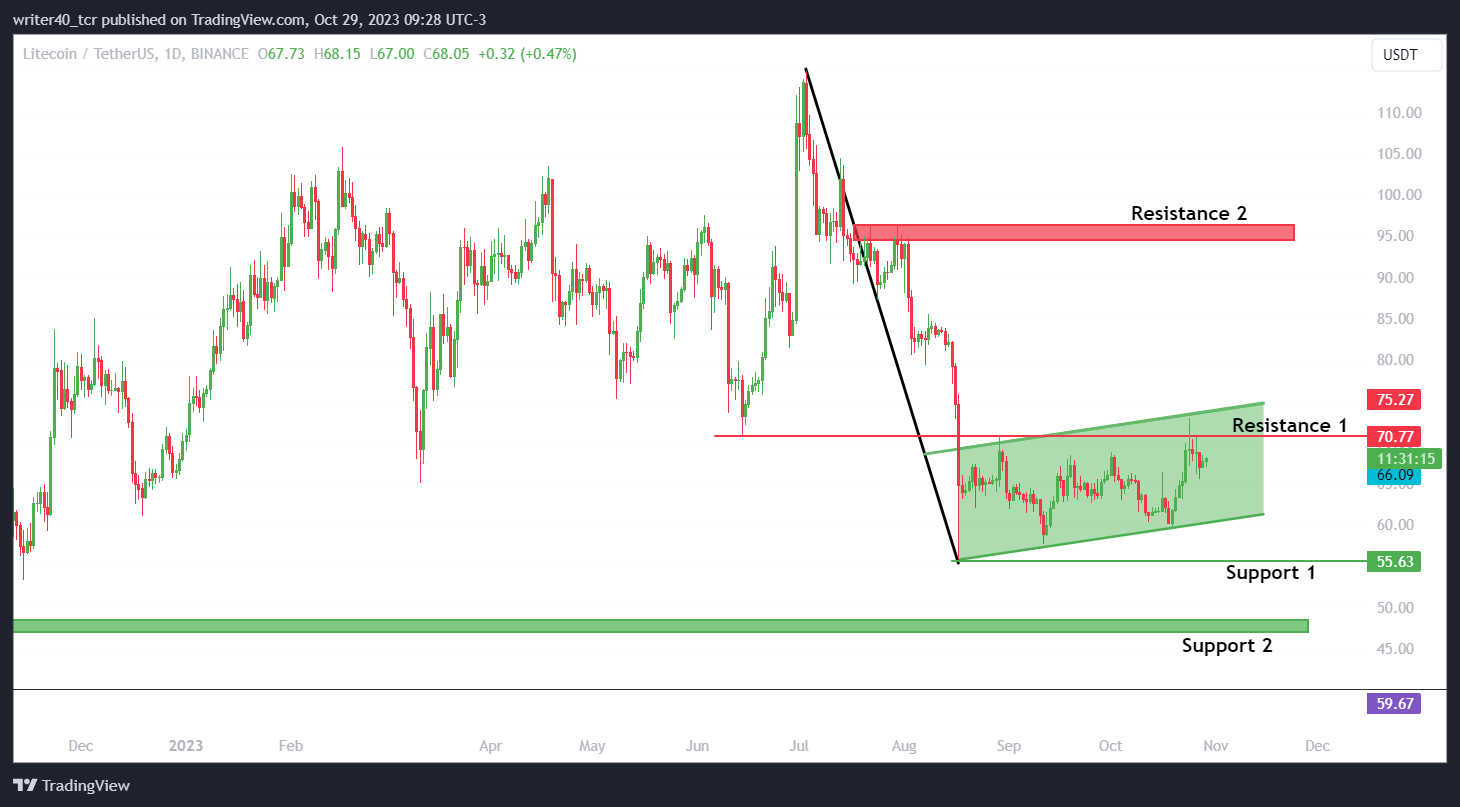
The resistance is present at the levels of $70.77 and $96.42. The support levels are present at the $55.63 and $46.89.
A Short Glimpse of the Bollinger Bands and Relative Strength Index
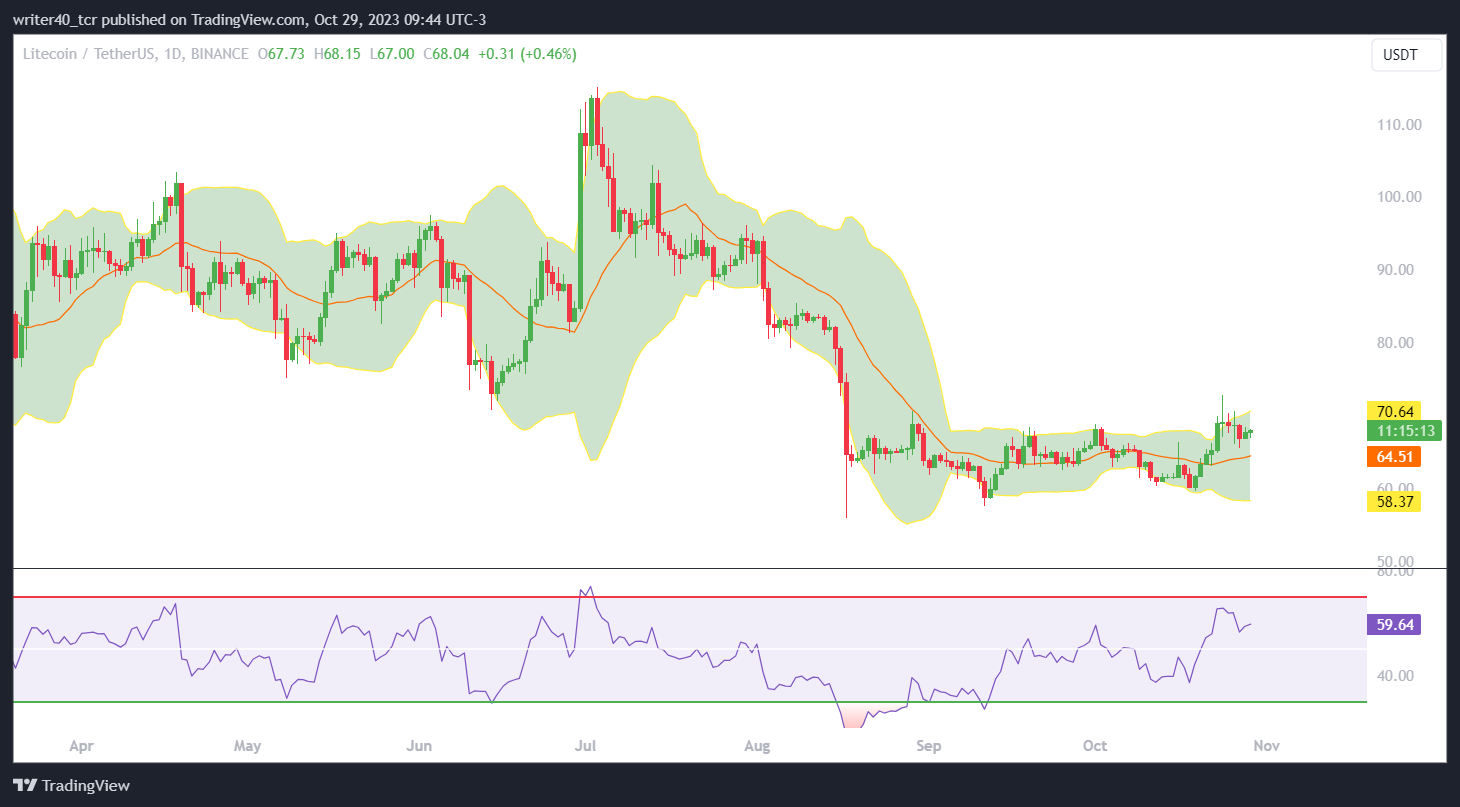
The LTC coin price has been trading flat and recently went outside the Bollinger Band and closed above the upper band. However, it swiftly came back inside the band and showed a bearish move. The relative strength index (RSI) is curving at the level of 59.64, which shows that the bulls are strong.
Conclusion
The LTC token price has been in a strong downtrend and is struggling to rise from the lower levels. It has formed an inverted flag and pole pattern, which is considered a bearish sign. The recent behavior of the coin price with the Bollinger Band is noteworthy and is indicating bearishness. The price can exhibit some volatility only if it breaks the inverted flag and pole pattern.
Technical Level
Resistance – $70.77 and $96.42
Support – $55.63 and $46.89
Disclaimer
The views and opinions stated by the author, or any people named in this article, are for informational purposes only. They do not establish financial, investment, or other advice. Investing in or trading crypto assets comes with a risk of financial loss.


