

- RBBN stock price made a new low at $1.79, after the breakdown of $2.18 support.
- Price is currently moving below the 50-day EMA and the 200-day EMA.
Ribbon Communications Inc. (NASDAQ: RBBN) is a telecommunication company that makes software, IP, and optical networking solutions. It provides its networking solutions to service providers, businesses, and vital infrastructure sectors around the world. The company also provides analytical solutions and next-generation products that offer cloud-native and stream analytics platforms.
Comparison of Financials and RBBN Stock
Last year, the company observed some negative declines in its annual profits. It reported its annual turnover as $819.76 Million which decreased by 2.98% compared to the year 2021. This also had a huge impact on the stock price which dropped over 60% in 2022.


According to the third quarter, the firm has observed positivity in its net income and net profit margins up to 26.69% and 25.20%. However, the revenue experienced a decrease of 1.91% as per the year-to-year change.
In the current month, the RBBN stock price has given a breakdown of an internal support level of $2.55. As a result, it dropped almost 29% with an impulsive bearish move. At present, the price is at the value of $2.08.
The RBBN stock price is trading near its yearly low range of $1.78 while having a yearly target of $6.00. The earnings-per-share (EPS) has also decreased by $-0.32. RBBN stock’s current market cap is $355,986,216.
Technical Analysis of the RBBN Stock Price
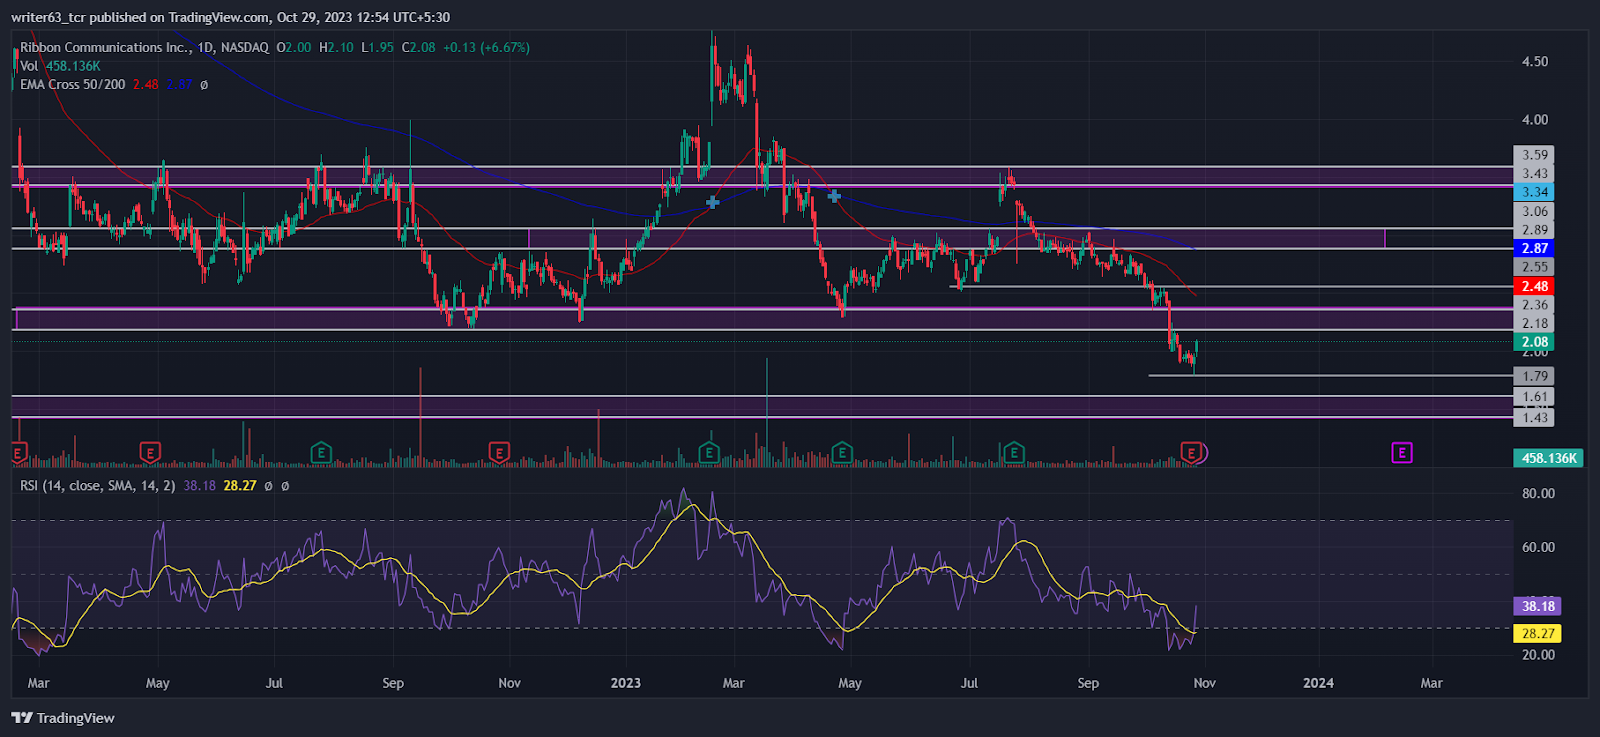
RBBN stock price is moving below the 50-day EMA and the 200-day EMA reflecting a strong downtrend. It faced resistance from the 50-day EMA at $2.89 which led the price to fall further down almost by 37%.
At press time, the RBBN stock price took support from the $1.79 level after a fall of more than 40% from the $3.43 resistance level. In the last two trading sessions, it formed bullish candles at $1.79 reflecting the buyers’ sentiments for a bullish reversal. RBBN’s price is moving toward an immediate resistance of $2.18 for a retest of the breakdown level.
Furthermore, the relative strength index (RSI) is showing some signs of divergence by overcoming the oversold region below the 30-mark lower band. Currently, the RSI is sloping above the signal line at 38.18.
Conclusion
The RBBN stock price is moving in a strong downtrend. It is below the 50-day EMA and 200-day EMA and recently faced resistance from the 50-day EMA. The price took support from the $1.79 immediate level by forming a bullish rejection candle. This reflects the buyers’ sentiments for a bullish reversal. At press time, RBBN’s price is moving toward an immediate resistance of $2.18 for a retest of the breakdown level. The next support and resistance levels would be $1.61 and $2.55.
Technical Levels
- Resistance levels: $2.55 and $3.06
- Support levels: $1.79 and $1.43
Disclaimer
The views and opinions stated by the author, or any person named in this article, are for informational purposes only. They do not establish financial, investment, or any other advice. Investing in or trading stocks comes with the risk of financial loss.


