

- The BN stock price is experiencing a decline of over 12% after the retest.
- The Trading Oscillator showed a hidden divergence before the downfall.
Brookfield Corporation (NYSE: BN) is a multinational investment management company in Toronto, Canada. With over $725 Billion of assets under its management, Brookfield Corporation is one of the largest alternative investment management companies. The company focuses on direct control investment in credit, private equity, renewable power, infrastructure, and real estate sectors.
Recent Overview of the BN Stock and Financials
The firm has been observing the massive drawbacks in its annual revenue since the year 2020. In 2022, it has estimated its revenue around $5.10 Billion. However, the company sales did not match the required potential and generated around $4.00 Billion. According to the June 2023, the earnings-per-shares (EPS) of the BN stock has crossed the estimated EPS by 13.04%. As an impact, the second quarter revenue has only decreased by 0.90% and the stock price surged over 13%.


BN stock paid a $0.07 dividend in the third quarter while the EPS of the second quarter was $0.76. The stock price has moved around 14% in the current month. After the retest of the bearish flag pattern, it dropped to the $29.33 demand level.
The BN stock price is performing near its 52-week low price of $28.25. It has evaluated a yearly target of $47.00. The current market capitalization of the company is $47.77 Billion.
BN Stock Price Analysis and Technicals
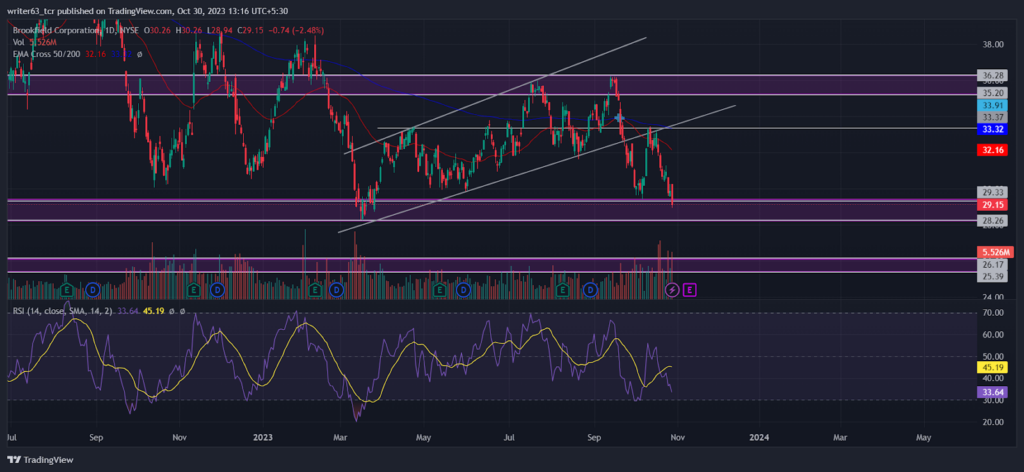
The BN stock price has dropped around 13% after the bearish crossover between the 50-day EMA and the 200-day EMA. The price is currently moving below both the EMAs, reflecting a strong downtrend. At present, the 50-day EMA is at $32.16 and the 200-day is at $33.32 respectively.
The price is trading in a downtrend. It formed a bearish flag pattern at the $28.26 level, which recently got broken by the sellers. The BN stock price successfully retested the breakdown level of $33.37. At press time, it is moving toward the bottom of the bearish flag at $28.26. The share price has the potential to break below that level.
Furthermore, the Relative strength index (RSI) is also sloping toward the oversold territory below the 30-mark lower band. The RSI signal line is at the 45.19 mark, above the RSI slope reflecting bearish momentum.
Conclusion
Since February 2022, the BN stock price has been performing in a bearish trend. It has recently given a breakdown of the bearish flag pattern at $33.37. It is currently moving toward the $28.26 support level. If the BN price closes below that level, it may fall further down to $26.17, which is the next support level. However, for the yearly target price of $47.00, it should break above the major resistance level of $38.76.
Technical Levels
- Resistance levels: $33.37 and $36.28
- Support levels: $28.26 and $25.39
Disclaimer
The views and opinions stated by the author, or any person named in this article, are for informational purposes only. They do not establish financial, investment, or any other advice. Investing in or trading stocks comes with the risk of financial loss.


