

- In the last trading session, the LULU stock price advanced by 1.2%.
- Lululemon Athletica Inc. has reported good results in Q3 2023.
Lululemon Athletica Inc. also known as Lululemon was founded in 1998 by Chip Wilson. The company operates in the Internet retail industry and the CEO of the company is Calvin R. McDonald. Lululemon has 34K employees currently and its headquarters is located in Vancouver.
The price-to-earnings ratio of the LULU share is 48.99, which represents that the investors are willing to pay higher prices for the stock price. The EPS of the LULU stock is 7.92 USD. This stock’s price is certainly more volatile than the market as a whole because it has a beta of 1.51.


110.414M shares are currently floating in the market out of which 9.07% shares are held by insiders and investors. The company mainly operates in the United States and has made 69.72% of its revenue from the same country.
The average trading volume of the LULU stock for the last three months is 1.918M shares resulting in a market cap of $51.577B. The operating margin of the company is 21.69% followed by a debt/equity ratio of 33.78%.
Lululemon Athletica Inc. Financial Analysis
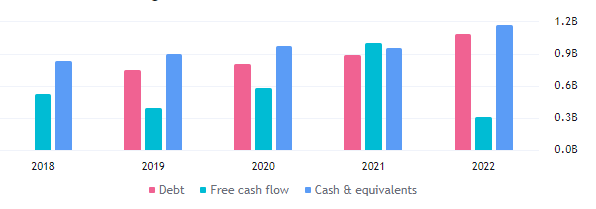
The reported net income of the LULU stock is $854.80M, resulting in a profit margin of 10.54%. Also, the reported debt by the company is $1.07B followed by a free cash flow of $303.90M by the end of 2022. The company also reported an advance of 18.2% in the revenue of the company in Q3 2023.
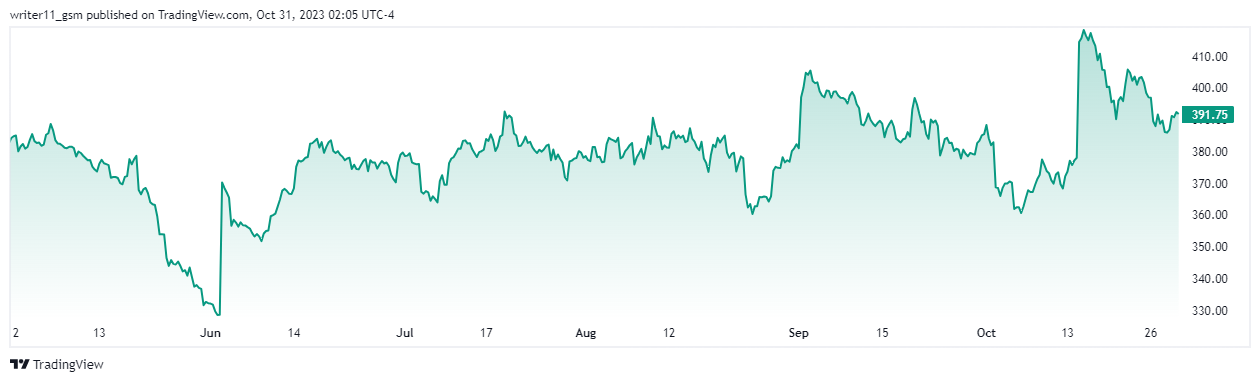
Lower Low Pattern On LULU Stock Chart, What’s Coming Ahead?
a by writer11_gsm on TradingView.com
The LULU stock price has been consistently advancing to higher levels. Despite the advance in the stock price, it seems to be losing momentum on the charts. This is because, after every breakout above the previous swing high, the LULU stock is facing selling pressure.
Based on the most recent price action, the LULU stock price is making lower low patterns. This behavior of the stock can lead the share price to a low of $355.00.
The LULU share price, after declining from the higher levels, is taking support at the 50-day EMA level. The 50-day and the 200-day EMAs are trading in a golden cross on the stock’s daily chart.
The RSI for the LULU share price is taking support at the 50-level and is currently trading at a level of 51.70. It denotes the lack of momentum in the stock price, which can take the share price to further new lows.
Conclusion
The financials reported by Lululemon Athletica are reliable and have improved year-on-year. The most recent price action on the chart of LULU stock shows bearishness as the stock is declining from higher levels. If the LULU stock price manages to break above the $395.00 level, it can hit new highs in the upcoming days.
Technical Levels
- Support levels- $328.00 and $354.00
- Resistance levels- $419.00 and $478.00
Disclaimer
The information provided in this article, including the views and opinions expressed by the author or any individuals mentioned, is intended for informational purposes only. It is important to note that the article does not provide financial or investment advice. Investing or trading in cryptocurrency assets carries inherent risks and can result in financial loss.


