

- The PANW stock has a basic EPS of 1.44 USD, which denotes that the company is making a profit.
- The company’s financials have been consistently improving throughout the years.
Palo Alto Networks Inc. is a multinational cybersecurity company. The CEO of the company is Nikesh Arora and has its headquarters in Santa Clara. The company has 13.94K employees and it is listed as PANW in the NASDAQ exchange.
The PANW stock has 303.969M shares floating in the market. Following the same the beta of the stock is 1.72. It represents the stock to be significantly more volatile than the market.


The PANW stock follows a very high PE ratio of 188.31, which represents that the stock might be overvalued. The company does not pay any dividends to its shareholders.
The last trading sessions trading volume for the PANW stock is 1.987M followed by a market cap of $73.615B. The Palo Alto Networks has given a return of 41.70 on equity and the ROA of the company is neutral. The debt/equity ratio of the company is 129.87%.
Palo Alto Networks Inc. Financial Analysis
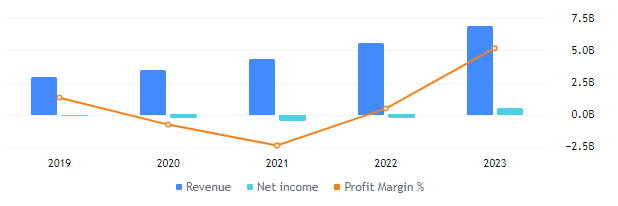
It can be seen on the revenue chart that Plao Alto Networks Inc. has witnessed a very goof advance in the revenue for the last five years. Most recently reported revenue of the company is for Q3 2023. The revenue of the Palo Alto Networks has advanced by 26.0% and the market cap has also advanced by 53.8%.
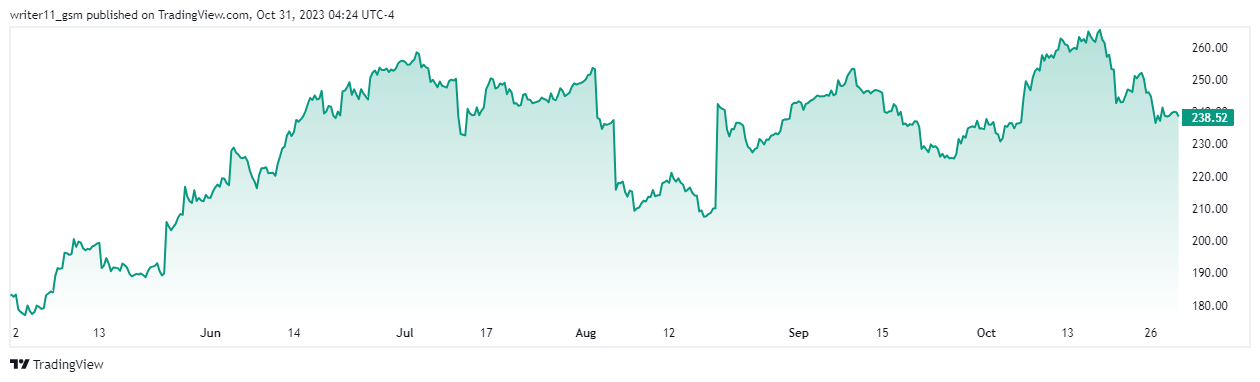
PANW Stock Taking A Pause After Huge Advance In Price
a by writer11_gsm on TradingView.com
The PANW stock price was consistently advancing to higher levels for a long time. It was following a strong trend. The PANW stock price has advanced by more than 1100% since its all-time low. The stock price has formed conistent higher high patterns which has led it to much higher levels.
The PANW stock price has been consolidating for a short span of time. It also broke out above the pattern but has been unable to sustain above the same. Thus, the PANW stock price started to decline and reversed. Currently, the stock price is trading inside the consolidation zone and can also decline to further lows.
The 50-day and the 200-day EMAs are following a golden cross on the charts. Despite this the PANW stock price has declined below the 50-day EMA and might continue to decline to further lows.
The RSI for the PANW stock is weak on the charts and has suddenly declined below the 50-level. It is currently trading at a level of 43.38 declining below the 14-day SMA line.
Conclusion
Despite of the good financial performance of the company over the years, the technicals of the PANW stock are looking weak on the charts. The share price might enter in the retracement territory as it has been consistently advancing to the higher levels.
Technical Levels
- Support levels- $201.00 and $226.00
- Resistance levels- $254.00 and $266.00
Disclaimer
The information provided in this article, including the views and opinions expressed by the author or any individuals mentioned, is intended for informational purposes only. It is important to note that the article does not provide financial or investment advice. Investing or trading in cryptocurrency assets carries inherent risks and can result in financial loss.


