

- LU stock price has given a breakdown from the bearish flag.
- Price took immediate support from the $0.8707 level.
Founded in 2005 in China, Lufax Holding Ltd (NYSE: LU) is a technology-empowered financial service and holding company. It is mainly engaged in offering financial services for small and micro enterprises. The company conducts its business through subsidiaries, engages in wealth, bank-funded loans, and trust-funded loans, and provides access to financial products and services.
Company’s Financials and Stock Performance
LU stock price is experiencing declines in value, it is falling around 53.21% as per the year-to-date returns. The firm reported its annual revenue as $8.42 Billion, which crossed above the estimated revenue by 1.48% in 2022. In the second quarter of 2023, the LU stock reported its earnings-per-share (EPS) as $0.06 increased by 9.10% compared to the estimated value. However, it observed some negativity in sales and its Q2 revenue decreased by 8.52%. In August 2023, the LU stock price gave a breakdown from the bearish flag pattern Subsequently, the price fell more than 35% by an impulsive bearish move and it took immediate support from the $0.8707 level.


The LU stock price is currently trading at $0.9498, closer to its yearly low range of $0.8711. It has a one-year target of $1.54 while having $0.55 as EPS. The current market capitalization of the LU stock is $2,232,979,000.
Technical Analysis of the LU Stock
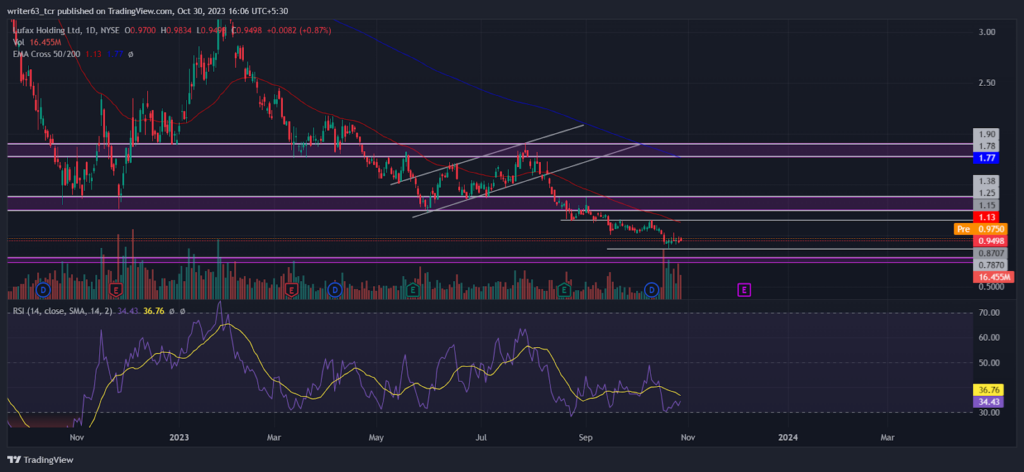
The LU stock price is moving below the 50-day EMA and the 200-day EMA, displaying a downtrend. The price has recently crossed below the 50-day EMA, which caused a fall of over 40%. If the price manages to close above the 50-day EMA, a short-term uptrend may occur.
At press time, the LU stock price is trading at the $0.9498 level. It took immediate support from the $0.8707 level. The price faced resistance from the previous lower structure. In the last trading session, it formed a bearish candle at $0.9750 showing the bearish sentiments on that level. If the price breaks above the $1.15 resistance level, it can become the pivotal point for a potential reversal.
Moreover, the relative strength index (RSI) is sloping near the 30-mark lower band. The signal line is above the RSI slope, indicating selling momentum in the current trading phase.
Conclusion
At last, the LU stock price is performing in a bearish trend. The price is certainly falling further by breaking below the support. The 200-day is moving above the current price of the stock. So, if the price breaks above the $1.15 resistance level, it can become the pivotal point for a potential reversal. The price can down further if it closes below the $0.8707 immediate support level.
Technical Analysis
- Resistance levels: $1.15 and $1.38
- Support levels: $0.8707 and $0.7870
Disclaimer
The views and opinions stated by the author, or any person named in this article, are for informational purposes only. They do not establish financial, investment, or any other advice. Investing in or trading stocks comes with the risk of financial loss.


