

- UBS has cut down the target price of the Newmont corporation stock price.
- Newmont Corporation has reported its earnings, which misses estimates.
- The NEM stock has formed a falling wedge pattern on the daily chart.
Newmont Corporation stock has been in a strong uptrend since 2015 and its price has shown a surge of over 500% in seven years. It is considered a good gain within such a short period. However, the stock price has started declining since April 2022 and it has melted down over 55% of the gains made in the past seven years.
In 2023, the Newmont Corporation stock price showed a decline in its price. It has fallen over 27% from the highs it made of $53.79 on 25 January 2023. After that, the stock price has formed a lower high and lower low which is considered a bearish chart formation. The stock price has been trading near the year-low level of $34.81, which it created on 4 October 2023.


UBS has cut down the target price of the Newmont Corporation stock from $53 to $42. However, it has maintained the previous rating of “NEUTRAL” on the stock. The stock has recently released the earnings report and it has missed the market estimates. In the last trading session, Newmont Corporation stock’s price escalated by about 3.98%.
An Outlook of the Newmont Corporation Stock Chart
The NEM stock price has formed a falling wedge pattern, which is marked in the chart below. The stock price has almost spent a whole year inside that pattern and is inching closer to the upper trendline. The upper trendline resistance level is present at the level of $40.66 and the lower trendline support is present at the level of $34.35. It has formed a super bullish pattern on the daily chart in the previous trading session.
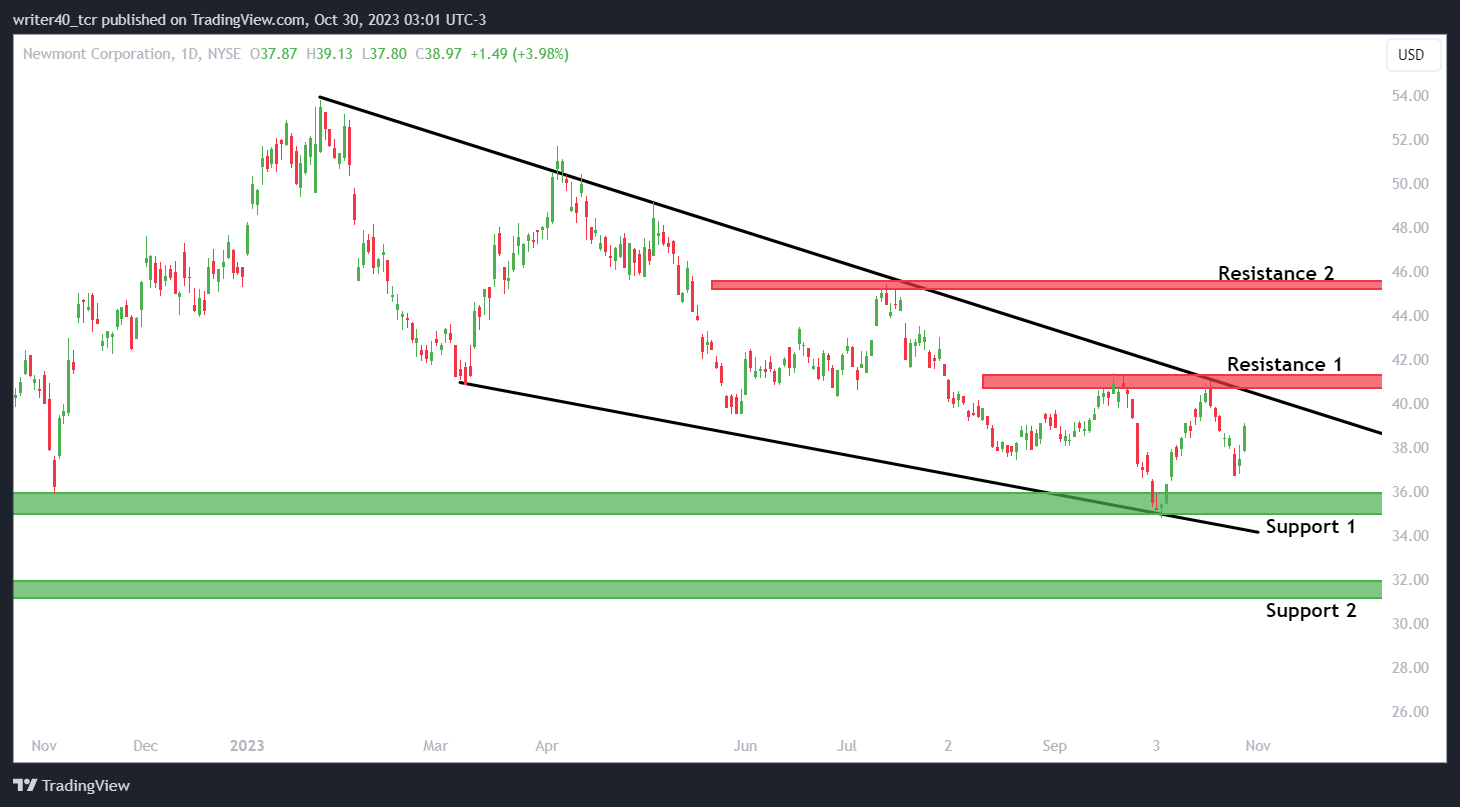
The major resistance and support for the price are present near the trendline as it is respecting that only. However, if we check the resistance level of the stock price, it is present near the $41.30 and $45.45 levels. Considering the support levels of the stock they are present at the level of $34.95 and $31.04.
A Glimpse of the EMAs and Relative Strength Index
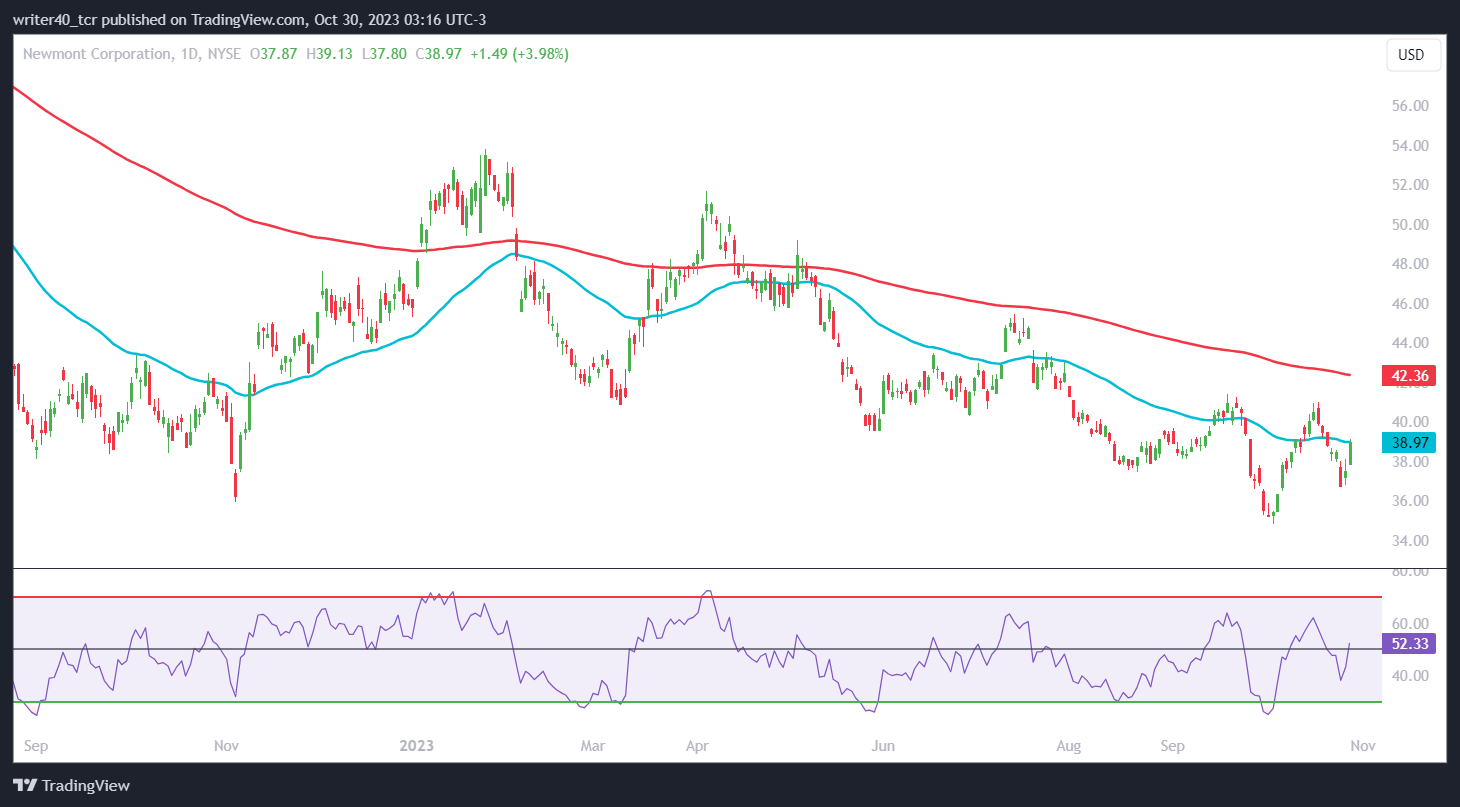
The NEM stock price is trading below the 50-day and 200-day Exponential Moving Averages. In the previous trading session, the stock price closed just at the 50-day exponential moving average. It has faced a rejection between the 50-day and 200-day EMA multiple times. The relative strength index is placed at the level of 52.33, which suggests that the bulls are in great momentum.
Conclusion
The NEM stock price has been trading in a falling wedge pattern and the earnings of the company are not up to the mark. If the stock price breaks that pattern on the upside, it can move toward the levels of $41.30 and $45.45. However, a bounce may occur from the $34.95 and $31.04 levels.
Technical level
Resistance – $41.30 and $45.45
Support – $34.95 and $31.04
Disclaimer
The views and opinions stated by the author, or any people named in this article, are for informational purposes only. They do not establish financial, investment, or other advice. Investing in or trading crypto assets comes with a risk of financial loss.


