

- Spotify observed an increase of 19.48% in sales in its third quarter.
- The SPOT stock price got a pullback from the 200-day EMA.
Founded on 23 April 2006, Spotify Technology S.A. (NYSE: SPOT) is a media and audio streaming company headquartered in Sweden. With over 574 Million active users, it is one of the largest music streaming service providers in the world. The company provides offline and online access to music and podcasts. It sells its premium services to users directly and also through partners such as telecom companies.
Spotify Company Financials and Stock Price Details
At the end of 2022, the company reported its annual revenue as $12.55 Billion. It came with a surprise increase of 0.05% compared to the estimated revenue. Meanwhile, the SPOT stock price witnessed a massive decline of 66.27%. As per the 2023 third quarter, the firm has estimated its revenue as $3.52 Billion. Surprisingly, it has generated a quarterly revenue of $3.55 billion, which increased by 0.86%. Subsequently, the SPOT stock price decreased by 3.68%. In the current month, the SPOT stock price has observed an increase of 3.05% by covering up the previous month’s closing price of $154.64. The price is currently recovering from a massive downfall of over 77% since November 2021.


The SPOT stock price is performing between the 52-week high/low of $182.00/$69.25. It estimated its one-year target as $175.50. The earnings-per-share (EPS) has surprisingly increased by 247.78%.
Technical Analysis of the SPOT Stock
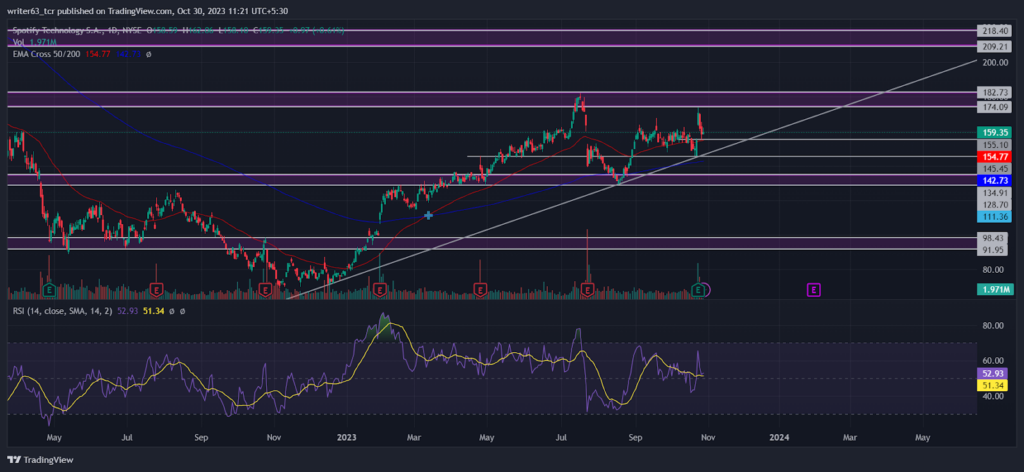
The 200-day EMA has become an uptrend supporter of the SPOT stock price. In a wider outlook, the price is currently moving above the 50-day and the 200-day EMAs, reflecting the strong bullish trend.
The SPOT stock price took support from the $128.70 level after it faced resistance from the $182.73 level. At press time, the price is trading at the $159.35 level and it overcame the consolidation phase below. It is taking support from the $155.10 level. In the last trading session, the price formed a bullish candle at $158.10, displaying buying sentiments at that level.
According to the Oscillator, the relative strength index (RSI) is moving similarly to the price trend, indicating a clear bullish momentum. At present, the RSI slope is at the 52.93 mark above the middle band, and the signal line is at the 51.34 mark.
Conclusion
The SPOT stock price is moving in an uptrend. The price took support from the trendline forming below at the $128.70 level. It also came out from the consolidation phase and currently taking support above it and the 50-day EMA. Therefore, the price may go bullish in the near future. At press time, it is moving toward the $182.73 resistance level. While moving toward the resistance level, it can also achieve its one-year target price of $175.50.
Technical Analysis
- Resistance levels: $182.73 and $218.40
- Support levels: $145.45 and $128.70
Disclaimer
The views and opinions stated by the author, or any person named in this article, are for informational purposes only. They do not establish financial, investment, or any other advice. Investing in or trading stocks comes with the risk of financial loss.


