

- The Trinity Industries stock price has declined by over 7% in a week.
- Susquehanna has upgraded the rating on the Trinity Industries stock from “Neutral” to “Positive”.
- Trinity Industries has released its earnings, but it has missed Expectations.
The Trinity Industries stock price has been in a strong uptrend, as it witnessed a surge of over 157% since 2020. During this uptrend, the price has created an all-time high level of $32.96. That uptrend was halted in March 2022 and the price fell sharply from that level. It melted over 39% within three months.
The TRN stock price created a low of $19.88 on 14 July 2022 during that fall. The buyers have successfully defended this level till now for more than three times. However, the sellers present in the stock are trying to challenge the buyers present at the lower level. The selling pressure is looking strong as of now. It will be difficult for the buyers to defend the level this time.


Susquehanna has recently upgraded the rating of the Trinity Industries stock from “NEUTRAL” to “POSITIVE”. It has also increased the target price from $29 to $32. However, the company has released its earnings report and it has failed to deliver according to the market expectations. The stock price has faced solid selling pressure after that.
A Quick Analysis of the Trinity Industries Stock Chart
The TRN stock price has formed a descending triangle pattern on the daily chart and it is trading very close to the lower level of the same. It is considered a bearish pattern and the price action is also indicating the same about the stock. The stock price has formed a 6-day losing streak, which is also favoring the bearish sentiment at present.
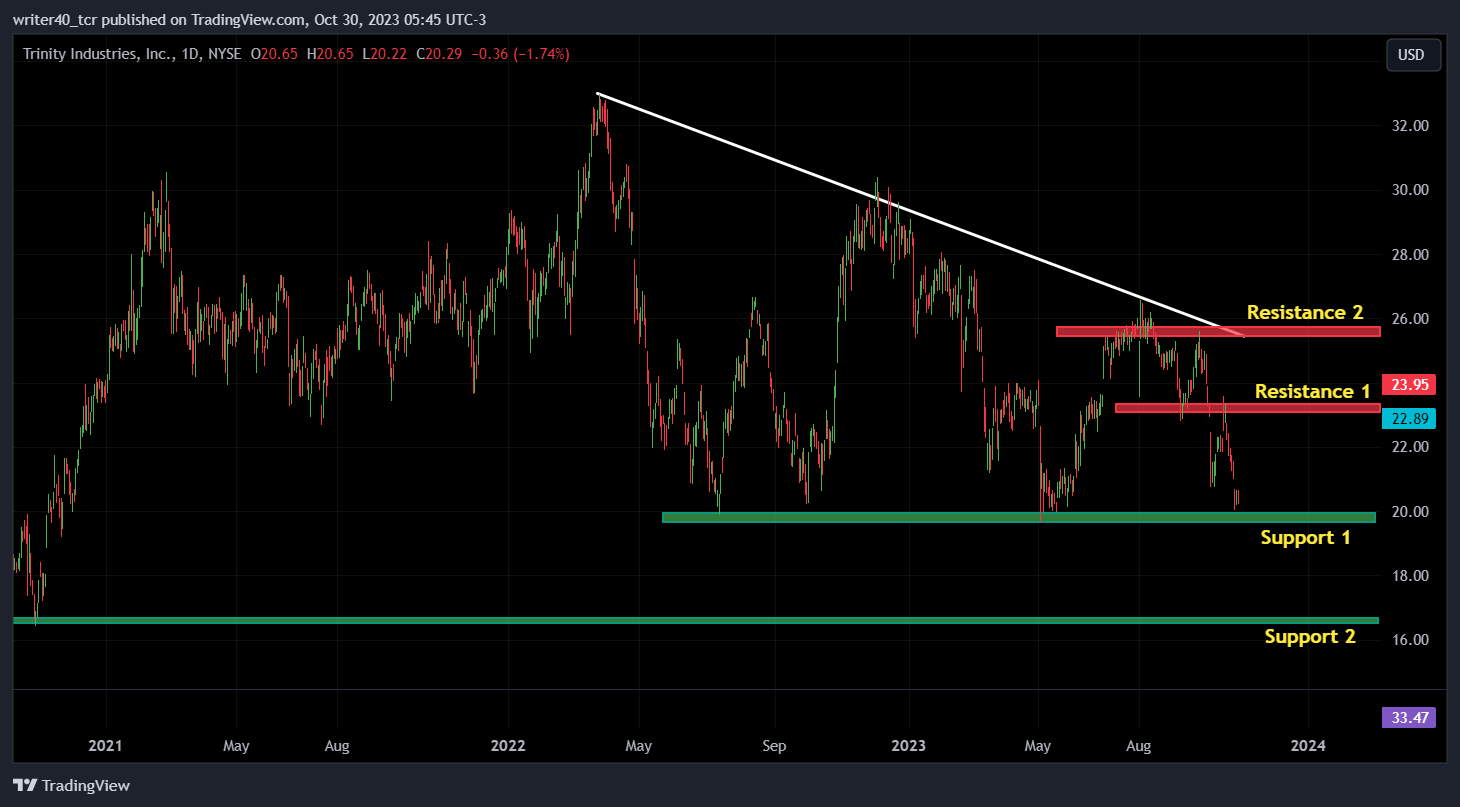
The TRN stock price is currently trading close to the support level of $19.64. Apart from this, the next support for the price is near the level of $16.57. Considering the resistance level for the price, it is present at levels of $23.7 and $25.78. These levels are marked in red and support levels are marked in green.
What Do EMAs and Relative Strength Index Indicate About the TRN Stock?
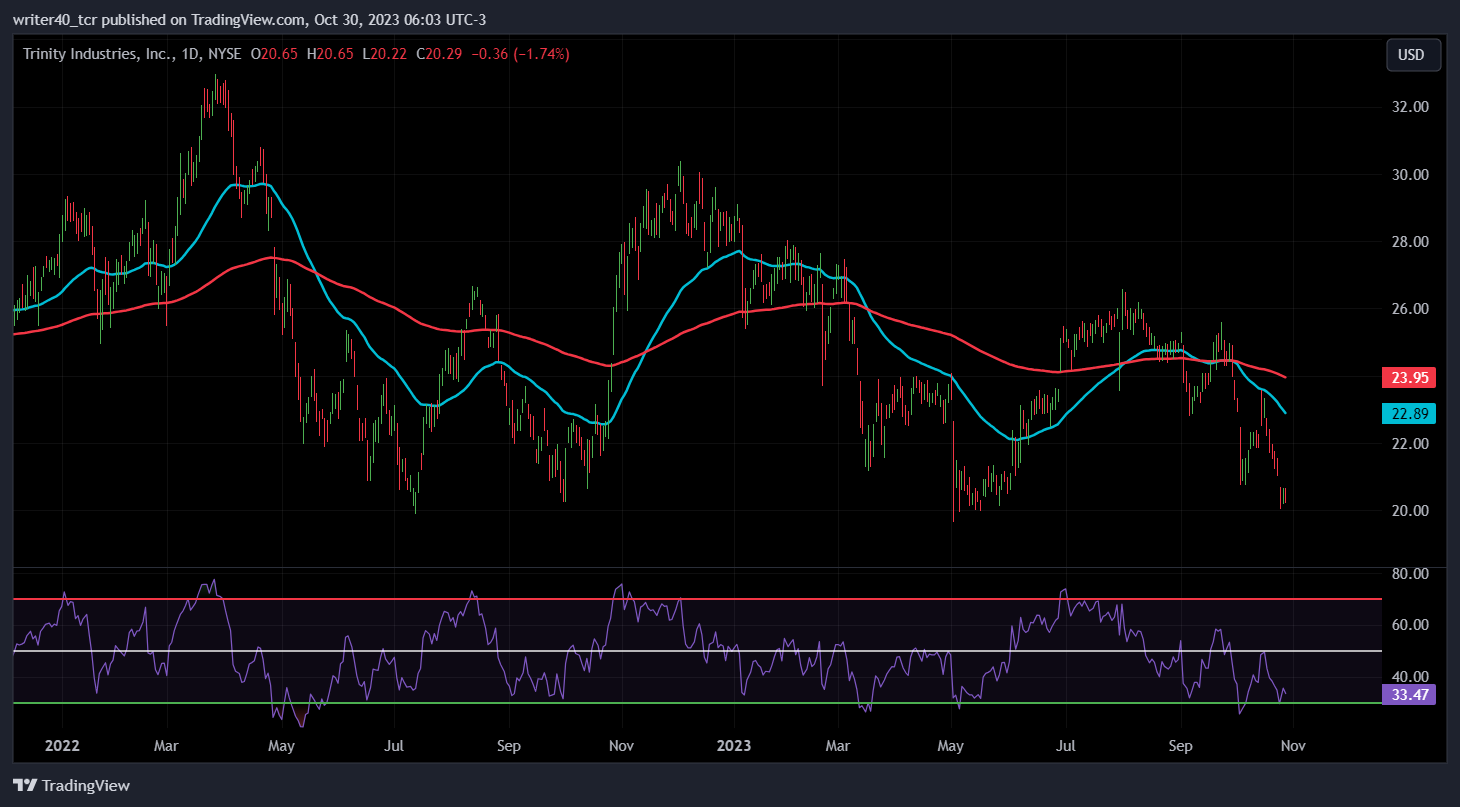
The TRN stock price has recently faced rejection from the 50-day Exponential Moving Average and it is a negative sign for the stock price. Along with that, the EMA has shown a Death Crossover on the daily time frame and it is also a bearish sign. The relative strength index is curving at the level of 33.47, which shows that the bears are very strong at present.
Conclusion
The stock price is indicating a possible breakdown from the support level of $19.64. It can lead the price towards the next support level of $16.57. However, if the price rises from here, it can achieve the $23.06 and $25.43 levels.
Technical Level
Resistance – $23.7 and $25.78
Support – $19.64 and $16.57
Disclaimer
The views and opinions stated by the author, or any people named in this article, are for informational purposes only. They do not establish financial, investment, or other advice. Investing in or trading crypto assets comes with a risk of financial loss.


