

- In the last five years, the HOOD stock has lost its value by 76%.
- The Robinhood Markets Inc. share is trading with a negative EPS.
Robinhood Markets Inc. was founded in the year 2013 and provides financial services to its customers. It is basically a financial broker that lets traders and investors invest and trade through their platform. The current CEO of the company is Vladimir Tenev. The company has 2.3K employees and has its headquarters in Menlo Park.
The ROE for Robinhood Markets Inc. is 2.22% which is neutral for the company, and the resulting ROA for the same is 1.59%. Even the debt/equity ratio of the company is 1.22%. It is again neutral for the company.


Despite neutral financial ratios, the current ratio of the company is 3.99. It shows the company is capable enough to repay its debt. The operating cycle of the company is pretty high resulting in 80.54 days.
The HOOD stock has 468.234M shares floating in the market and has a negative EPS of -0.93 USD. It indicates that the company is not profitable. Also, the beta for the HOOD stock is 1.35 making its returns more volatile than the average of the market.
Robinhood Markets Inc. Financial Analysis
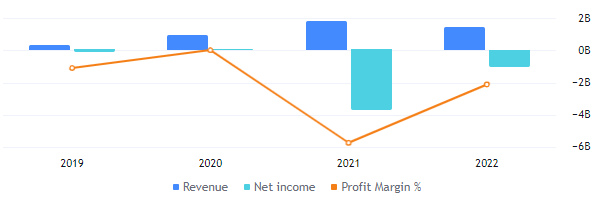
Robinhood Markets Inc. has witnessed a huge decline of -200.86% in the profit margin in the year 2021. The reported profit margin for 2022 is still negative but has improved compared to the last year. The reported revenue by the company for 2022 is $1.38B. All the revenue the company generates comes from the United States and is earned by trading and brokerage.
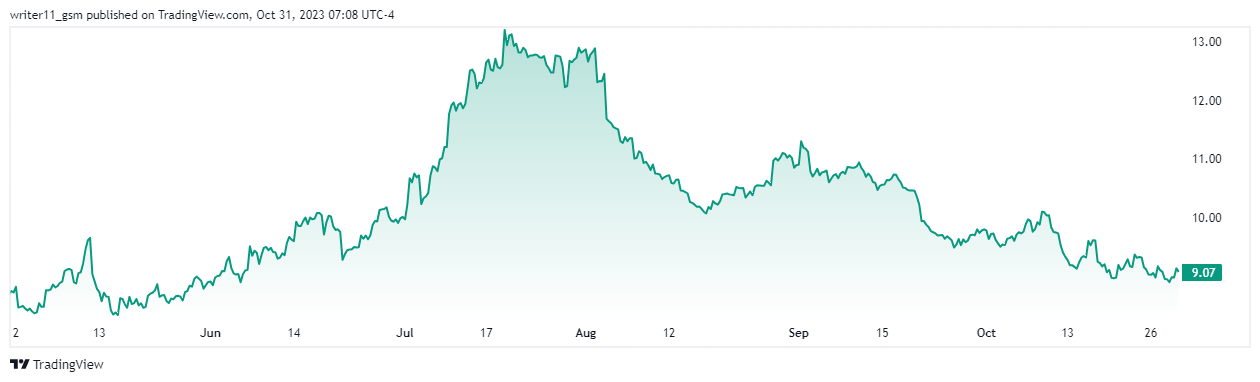
What Lower Levels Can HOOD Stock Show in the Upcoming Days?
a by writer11_gsm on TradingView.com
The HOOD stock has witnessed a huge sell-off since its IPO. The stock has not given any return to its investors and shareholders. This is due to a consistent decline in the share price for a long time. The stock price is still following a downtrend and might hit further lower levels.
On looking at the most recent price action we can see that the stock is breaking to lower low structure by creating lower high swings. A change in trend on the HOOD stock cannot be witnessed unless it breaks above the previous swing high.
The EMAs for the HOOD stock are trading in a death cross on the charts. The price of the stock is also declining, trading below the 50-day and the 200-day EMAs.
The RSI on the other hand represents a loss of momentum in the stock and is trading below the 50-level.
Conclusion
The company’s financials are not reliable and the HOOD share has been following a strong downtrend for a very long time. The share price of the HOOD stock can continue to decline to lower levels and can hit support in the upcoming days.
Technical Levels
- Support levels- $7.60 and $8.30
- Resistance levels- $11.30 and $13.20
Disclaimer
The information provided in this article, including the views and opinions expressed by the author or any individuals mentioned, is intended for informational purposes only. It is important to note that the article does not provide financial or investment advice. Investing or trading in cryptocurrency assets carries inherent risks and can result in financial loss.


