

- Union Pacific Corp. has a high amount of debt.
- Union Pacific Corp. has shown a decline in profit margin percentage.
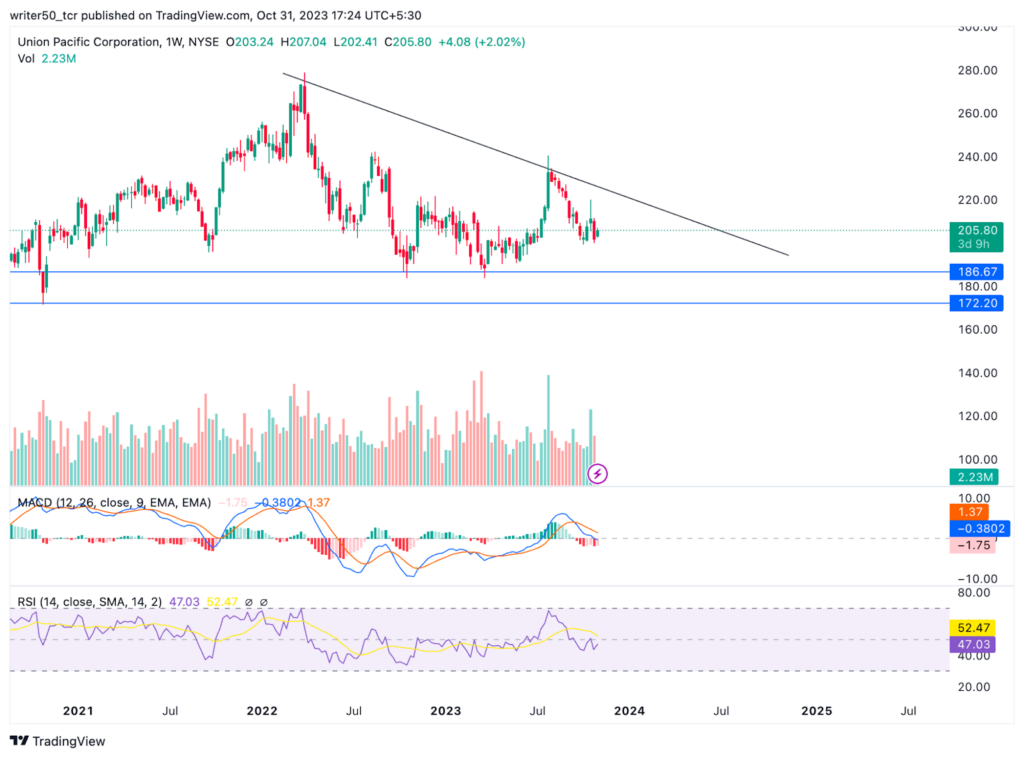
- UNP stock price is moving inside a triangle pattern.
The present price trajectory of Union Pacific Corp. stock unmistakably demonstrates a downtrend, characterized by the consistent establishment of lower lows. In the realm of financial performance, the profit margin percentage of UNP stock experienced a notable decline since the previous year. In 2021, the profit margin stood at 9.6%, but it receded to 8% in 2022. This decline in profit margin signifies a negative financial signal for the company. Turning to the technical analysis, the summary for UNP stock indicates a prevailing sell recommendation. Out of the 26 indicators that were examined, the majority convey sell signals, while only a few lean toward a buy signal.
Furthermore, the moving averages summary also leans toward a sell signal. This abundance of sell signals points to a dominant bearish sentiment in the stock. As for the historical price movements, UNP stock reached a high of $278 in March 2022, after which it embarked on a price decline. By the end of October 2022, the price fell by nearly 34%, ultimately finding support at the $186 level and subsequently experiencing a reversal. However, this reversal was short-lived and the price resumed its decline. The ongoing price movement has taken the shape of a descending triangle pattern with the current price remaining within its bounds.


The overall pattern of the stock appears weak in the weekly timeframe, and the price is forming a negative structure. It is anticipated that the price may continue to decline towards the support levels, and if it breaches these support levels, a further price decline could be observed. The company also has a debt of over $34 Billion and the free cash is less to fulfill the debt obligation.
Which Way Will the UNP Price Move?
Technical Indicators Summary
A deeper examination of the weekly MACD line for Union Pacific Corp. stock reveals that it currently resides beneath the signal line, signifying a bearish trend. The presence of a negative crossover further reinforces the likelihood of a continued decrease in the UNP stock price in the foreseeable future.
Similarly, the RSI line is positioned below the signal line, illustrating a bearish pattern that hints at a possible price decline in the upcoming days.
Moreover, a more thorough analysis of the charts unveils a gradual descent in the trading volume of UNP stock. This declining volume serves as a concerning indicator, aligning with the existing downtrend in the stock price and implying a reduced market activity.
Conclusion
As per the analysis, the UNP stock is moving downwards. The price has shown poor returns in the previous year and the profit margin has also declined. The overall structure of the stock is poor and the price is expected to decline further in the upcoming days.
Technical Levels
- Support Levels – $186 and $172
- Resistance Levels – $217 and $230
Disclaimer
The views and opinions of the author, or anyone named in this article, are for informational purposes only. They do not offer financial, investment, or other advice. Investing or trading crypto assets involves the risk of financial loss.


