
- The RIOT stock yielded more than 20% in the last three days.
- Riot Platforms Inc. has reported a negative income in the recent quarter.

Riot Platofrms Inc. is a mining company engaged in the mining of cryptocurrencies and generally mines Bitcoin. It was founded in the year 2000 and has only 489 employees. The current CEO of the company is Jason Les and the company has its headquarters in Los Angeles, United States.
The gross margin of the company is negative to -65.92% followed by a 52-week trading range of $3.25-$20.65. The EPS of the company is also negative at -1.66 USD and has a higher beta of 3.62.


The operating margin of the company is also negative to -42.33% following a debt/equity ratio of 1.76%. Despite this, the company has a price-to-book value of 1.52.
The company has 187.962M shares floating in the market and the company does not pay any dividends to its shareholders. RIOT stock has a market cap of $2.245B which has advanced by 8% in the last trading session.
Riot Platforms Inc. Stock Performance Analysis
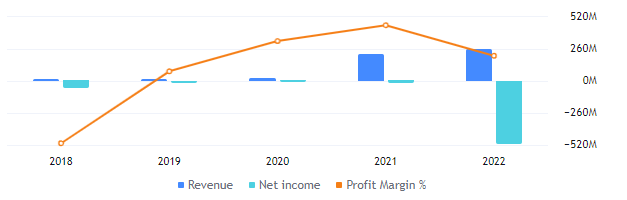
Riot Platforms Inc. has reported a revenue of $259.17M resulting in a negative net income of -$509.55M. This decline in net income has resulted in a negative profit margin of -196.61%. The company also has reported a debt of $22.25M in the year ending 2022.
RIOT Stock Preparing For A Breakout, What Can Happen Next?
RIOT Stock Chart By TradingView
The RIOT stock price is making a higher high pattern and is trying to advance to higher levels. After facing a decline of more than 50% from the recent swing high, the stock price is again trying to advance to higher levels.
The EMAs are trading in a death cross on the daily timeframe. The stock price has advanced above the 50-day and the 200-day EMA indicating a change in the trend of the stock. This indicates that the buyers are entering the stock.
The RSI is advancing above the 50-level indicating a bullish trend on the charts. It has also advanced above the 14-day SMA. This is a sign of bullish momentum on the charts.
Conclusion
The RIOT stock has reported a revenue increase in the recent quarter. Despite this the reported net income is negative. On the technical charts, the RIOT stock price is trying to advance to higher levels. If the stock price continues the upward momentum and breaks above the level of $12.70, it might further continue to advance to higher levels.
Technical Levels
- Support levels- $5.20 and $7.80
- Resistance levels- $19.00 and $23.50
Disclaimer
The information provided in this article, including the views and opinions expressed by the author or any individuals mentioned, is intended for informational purposes only. It is important to note that the article does not provide financial or investment advice. Investing or trading in cryptocurrency assets carries inherent risks and can result in financial loss.


