

- The DFI coin price is currently trading at $0.282870000.
- The price is currently trading inside a symmetrical triangle pattern.
The DFI price prediction at the time of writing is unpredictable as the price is trading inside a symmetrical triangle pattern. However, the gap left inside the pattern is very less so we can see a breakout or a breakdown of the pattern very soon. The direction, the price broke the pattern will decide its future trend.
The DFI coin price is making a lower high as well as the higher lows which shows the participation of buyers as well as sellers. It denotes both are trying to keep the price under their control.


It has been more than two months price has been trading inside the symmetrical triangle. There is a little gap left inside the symmetrical triangle which shows we can see a breakout or breakdown very soon.
The price has been trading inside a range too which is from $0.25547447 (support) to $0.30637087 (resistance). Currenlty, it is testing the resistance and is trading at $0.282870000 and has gained 0.1% in the last 24 hours.
Technical Indicators on DFI’s Current Price Movement
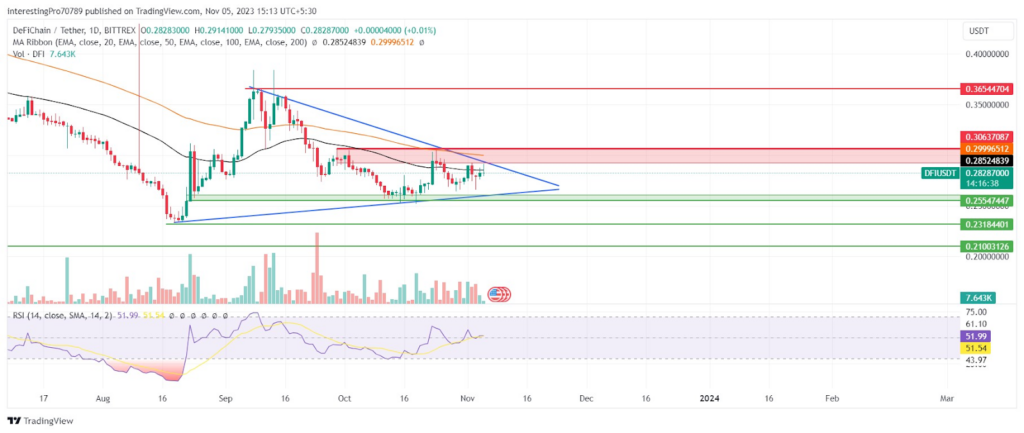
The DFI price is currently facing rejection from the 50-day EMA and is trading below the 50-day and 100-day EMA. It denotes the sellers are not letting the price move above the $0.30637087 resistance level. This shows that currently, the bears have more influence than the buyers.
The relative strength index is at 51.99 which is the neutral territory. The RSI line is completely sideways at the time of writing which shows the indecisive behavior of the price.
What’s Future Hold for DFI Coin?
The DFI price is displaying indecisive behavior at the time of writing. However, the price facing rejection from the EMA lines shows that the sellers are getting active in the current scenario.
DFI token price is making a shooting star pattern if it forms a shooting star candle and the next candle is close below the low of the shooting star candle. Thus, the price may fall from here to its $0.25547447 support.
The breakdown of this support level and symmetrical triangle will trigger the fall continuation in the fall in price. The price may be seen falling to its next support at $0.23184401. If it also breaks below this level then it may fall to its next support at $0.21003126.
On the upper levels, the breakout of the $0.30637087 and the symmetrical triangle may trigger a bullish rally. After the price may rise till its next resistance at $0.36544704.
Conclusion
The DFI future price movement is indecisive as it is trading inside a symmetrical triangle pattern. The technical indicators are also moving sideways which shows the low volatility in the market. The breakout or breakdown of the symmetrical triangle can increase the volatility and will decide the future price trend.
Technical levels
Resistance Levels: $0.30637087 and $0.35644704
Support Levels: $0.25547447, $0.23184401, and $0.21003126
Disclaimer
The views and opinions stated by the author or any other person named in this article are for informational purposes only. They do not provide financial, investment, or other advice. Investing or trading in crypto comes with a risk of financial loss.


