

- KDA coin price is moving toward the $0.612 resistance.
- The price has observed an increase of 14.54% during the weekly session.
Founded in 2016, Kadena (KDA) promises industrial scalability that can support global financial systems and vows to remain energy-efficient at scale and deliver more transactions. It can provide security for Bitcoin while giving unparalleled throughput that makes the blockchain usable to enterprises. Kadena offers 20 separate blockchains that all work to validate transactions.
Past Performance of the KDA Coin
On May 12, 2022, the KDA coin fell to the important support level of $1.367. At this level, the price took multiple attempts to break above the $3.513 resistance level but failed to do so. After five months, the price successfully broke below that level and fell over 40% to the $0.786 support level.


KDA coin price started a bullish rally to retest the breakdown level of $1.367. The price moved over 75% during this rally. Conversely, the sellers took active positions, after the retest which resulted in the breakdown of the immediate support level of $0.786.
Subsequently, the price fell to the $0.504 immediate support level. And from there, it again started a bullish move up to $0.700 which became an important resistance for a potential reversal in the KDA coin price.
From August to October, the $0.405 immediate support level prevented the KDA coin price from falling. This reflects that many buyers are showing interest in that specific support level. At present, the price is moving above the $0.490 important level.
Technical Analysis of the KDA Coin
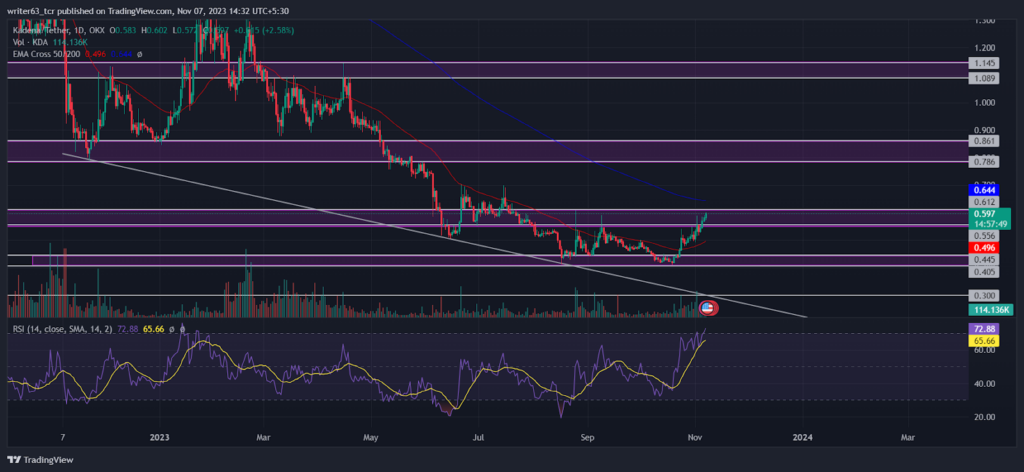
The KDA coin price is moving in a short-term uptrend between the 50-day and the 200-day EMAs. In the wider outlook, it faced resistance multiple times from the 50-day EMA. Recently, it broke above the 50-day EMA which resulted in a short-term rally.
At press time, the KDA coin price is performing at $0.581 after taking support multiple times on the $0.405 level. Recently, it also broke above $0.490 which became a key level for the buyers. Now, the price is moving toward the $0.612 resistance level. If the price breaks above that level, it may reach near the $0.700 important resistance level.
On the other side, the relative strength index (RSI) indicated a bullish divergence from the 30-mark lower band which led the price momentum in the bulls’ favor. Currently, the RSI is sloping at 70.01 at the 70-mark upper band.
Conclusion
KDA coin price is performing in a bearish trend supported by the channel line forming below. It took support multiple times on the $0.405 level. It also broke above the 50-day EMA which resulted in a short-term uptrend. However, the price may face major resistance from the 200-day EMA. At present, the KDA coin price is moving toward the $0.612 resistance level. If the price breaks above that level, it may reach near the $0.700 important resistance level. This level can become a pivotal point for trend reversal.
Technical Analysis
- Resistance levels: $0.612 and $0.700
- Support Levels: $0.490 and $0.405
Disclaimer
The views and opinions stated by the author, or any people named in this article, are for informational purposes only. They do not establish financial, investment, or any other advice. Investing in or trading crypto assets comes with the risk of financial loss.


