
 Boomer
 Minter
 Pearl
Pearl Pudgy Penguins
 Sui
Sui Covenant x402
 Pump.fun
- LINK coin has a market cap dominance of 0.548%.
- Chainlink (LINK) is ranked #13 on the list of top global cryptocurrencies.
Chainlink operates as a decentralized oracle network facilitating the connection of real-world data to smart contracts on the Ethereum blockchain.
This enables the development of secure and dependable decentralized applications (DApps). LINK, the native token of the Chainlink network, serves as the means of payment for services within the ecosystem.
Financial of the LINK Coin
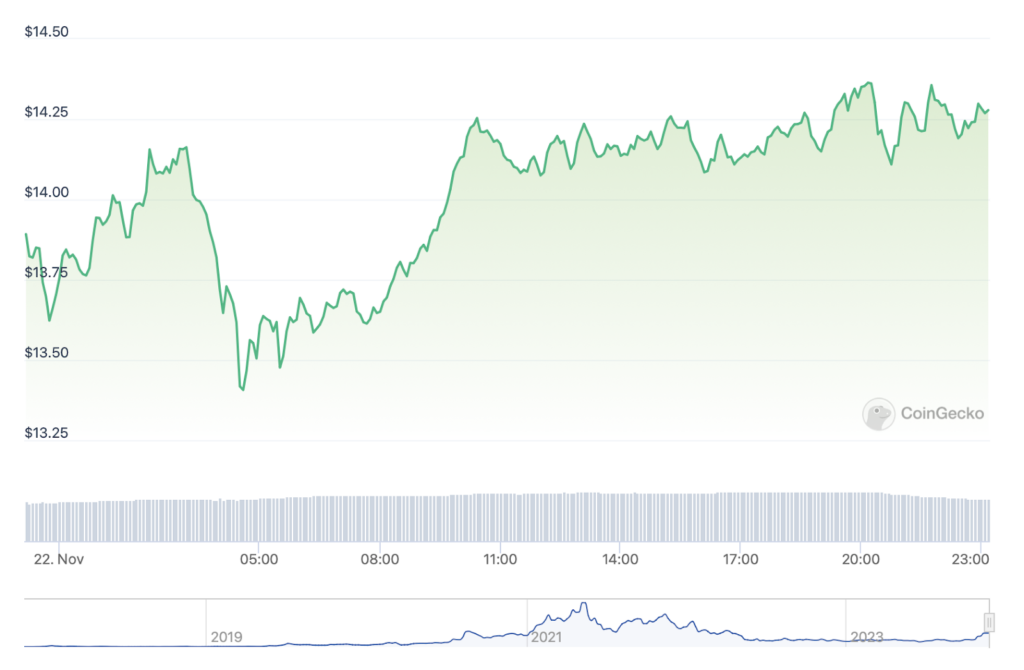
Currently, the Chainlink coin is trading at $14.265, reflecting a 7.2% increase in today’s market session and showcasing an impressive surge.
The market cap dominance of the Link coin 0.548%.
Ranked at #13 among top cryptocurrencies, LINK boasts a market cap of $7.9 Billion and a volume/market cap ratio of 0.10.
The coin witnessed an advance of over 143% last year and the technical indicators summary is also suggesting a buy signal for the LINK coin.
Revenue of LINK Coin
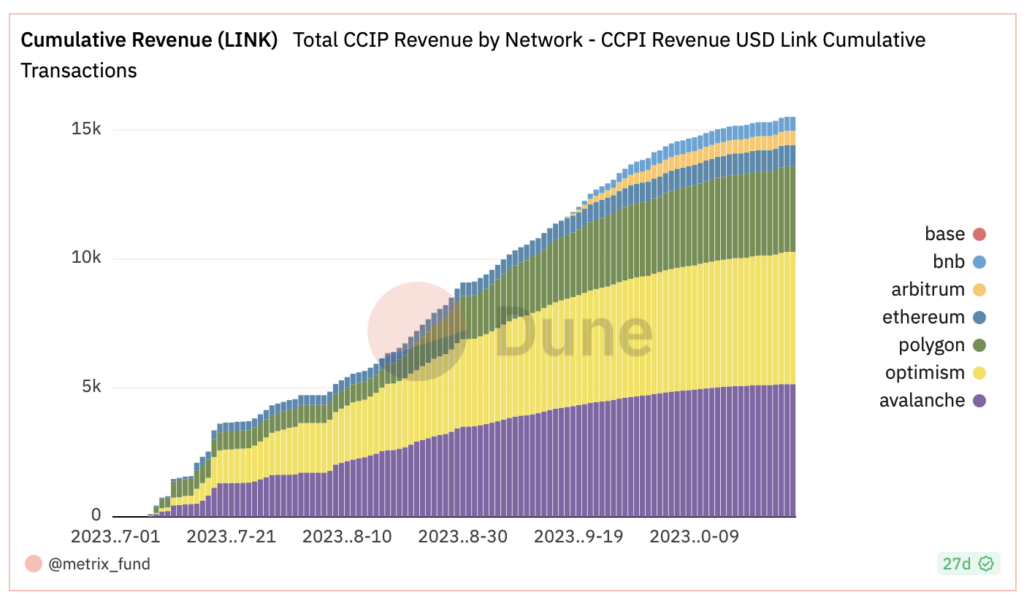
The cumulative revenue of the LINK coin is increasing year over year, showing a strong financial position.
Chainlink (LINK) Technical Analysis
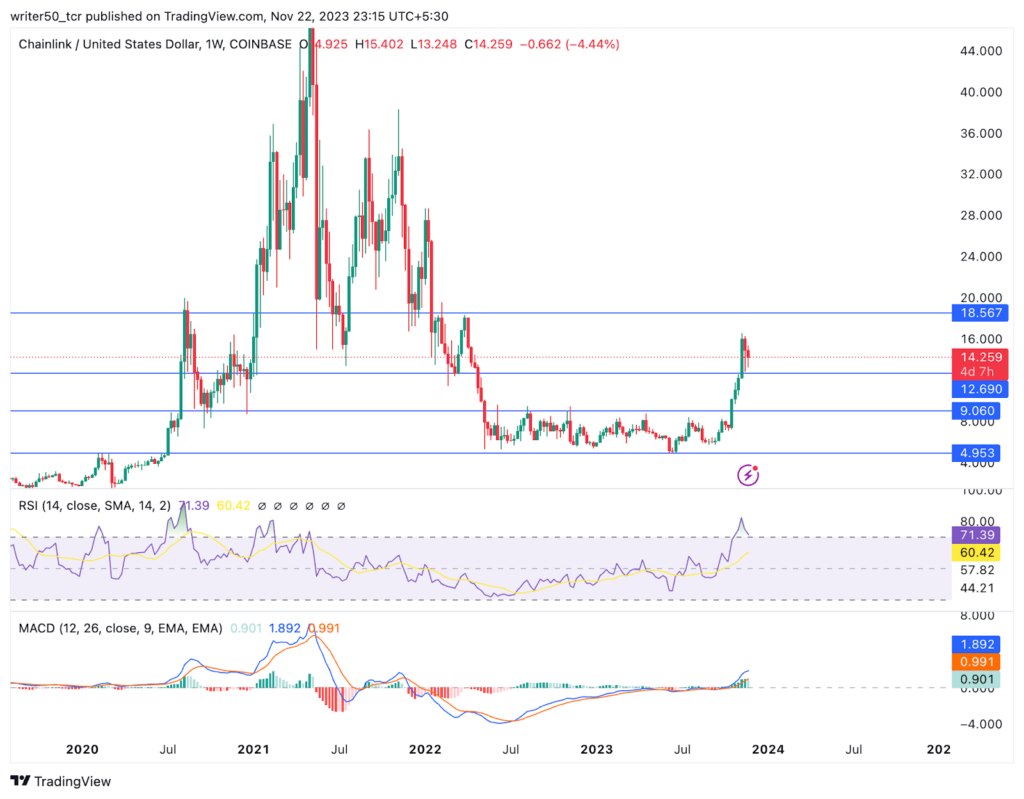
Moving upward, the LINK coin is forming a pattern of higher highs. After reaching a peak of $52.9 in May 2021, the price experienced a subsequent decline of nearly 90%.
Having found support at the $4.9 level, the price consolidated around this point for over a year. Recently, a breakout from this long-standing channel pattern has been observed.
The overall structure of the LINK coin is positive, with the price exhibiting a favorable pattern. This increases the probability for the price rise.
Technical Indicators Outlook About Chainlink
The current LINK coins MACD line is above the signal line. This is considered a positive pattern and the price is likely to rise in the future.
Additionally, both the RSI and SMA lines are above the 70 level, marking a positive zone. Signs hint at an upcoming positive crossover, indicating the potential dominance of sellers in the market.
Conclusion
Analyzing the coin reveals an upward trajectory in the Chainlink coin’s price. The coin has exhibited an impressive day-over-day return, showcasing an overall positive pattern. Indicators also present positive signals, indicating a bullish trend. Consequently, expectations point towards an anticipated rise in the coin’s price in the coming days.
Technical Levels
- Support Levels: $12.69 and $9.06
- Resistance Levels: $18.5 and $23.14
Disclaimer
The views and opinions of the author, or anyone named in this article, are for informational purposes only. They do not offer financial, investment, or other advice. Investing or trading crypto assets involves the risk of financial loss.




